After a year of prognosticating what might be the case, we now know what is the case . . . or at least as close to knowing as we can be.
The USDA’s Crop Production and Crop Production Annual Summary reports released last week are like receiving those end-of-year family Christmas letters with U.S. hay producers being the “family.” In the case of the USDA’s letters, you get not only the good news but also that of the bad and ugly nature. The insights provide a glimpse of the year gone by and a hint of where production and prices might be headed in the future.
December hay stocks
The USDA makes its annual assessment of hay stocks in May and December. Harken back to last May 1 when U.S. hay stocks exceeded 25 million tons following a winter’s worth of feeding. This was the highest spring stock number we had seen since 2005; only three years ago in 2013, May hay stocks totaled a mere 14 million tons, the lowest such stock number since 1950.
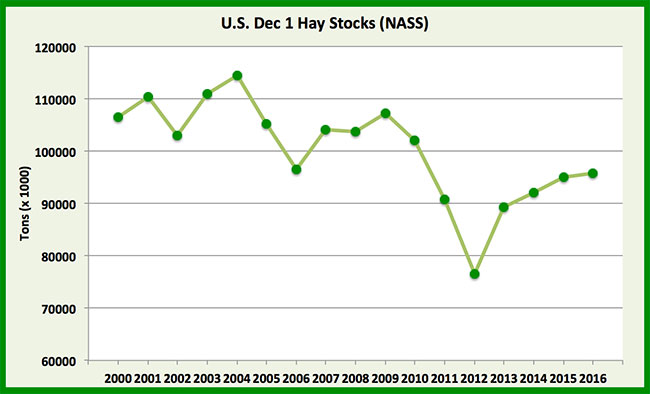
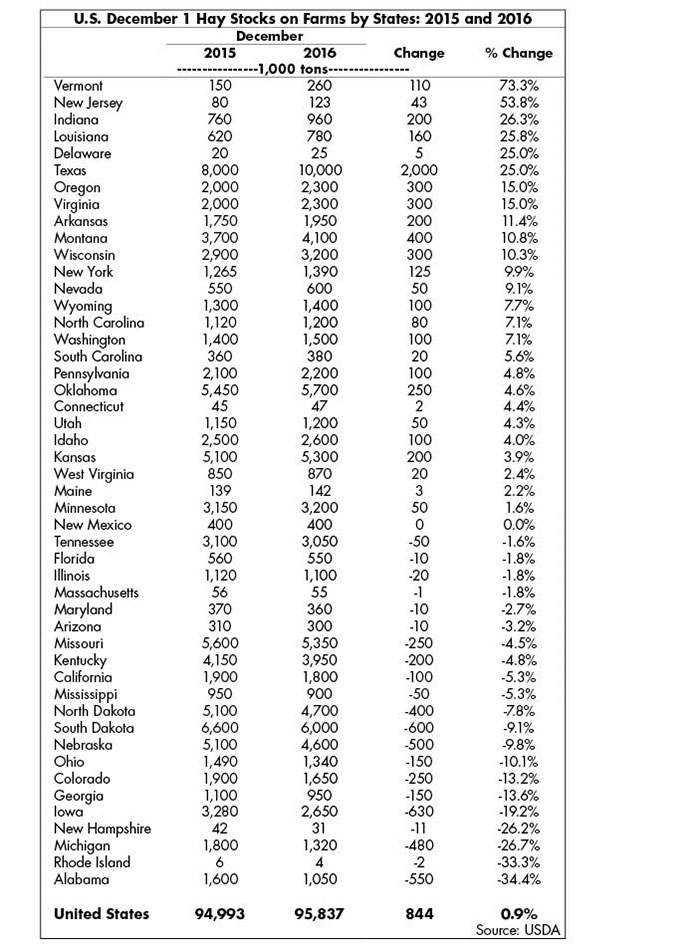
Last week, USDA pegged December 1 hay stocks at 95.8 million tons, up only 0.9 percent from one year ago. This was the highest December hay stock total since 2010 when supplies reached 102 million tons (see figure below). The year-over-year boost in stocks was less than 1 million tons compared to a nearly 3 million tons rise from December 2014 to 2015.
As might be expected, individual states varied in the direction and amount of hay stocks. In the West, California (down 5 percent), Arizona (down 3 percent), and Colorado (down 13 percent) saw hay stocks decline, while Idaho (up 4 percent), Washington (up 7 percent), Oregon (up 15 percent), Nevada (up 9 percent), and Wyoming (up 8 percent) experienced supply growth (see table).
States in the Southeast where drought persisted for much of the summer and fall had significant declines in hay stocks. This group was led by Alabama with a whopping 34 percent drop in year-over-year supplies.
In the Midwest, hay stock gainers were Indiana, Wisconsin, and Minnesota. Those with supply reductions were Michigan, Iowa, Ohio, Nebraska, North Dakota, South Dakota, Missouri, and Illinois.
Bottom line: U.S. hay stocks continue to climb but at a slower rate.
Harvested hay acres
Last June, USDA forecasted a jump in U.S. hay acres from 54.4 million in 2015 to 56.1 in 2016. Given the depressed price market and hay producer comments on acreage intentions, this came as quite a surprise.
Forget the surprise, in the final analysis USDA dropped its harvested hay acreage number to 53.5 million, down nearly 1 million acres from 2015.
Nearly all of the acreage reduction came in the form of alfalfa and alfalfa-grass mixtures where U.S. acres dropped from 17.8 to 16.9 million. Most of the major alfalfa producing states (over 400,000 acres) registered declines in acreage except for Idaho, Kansas, Montana, Oregon, Utah, and Washington.
Those states with the largest alfalfa acreage reductions were Iowa (down 220,000), Wisconsin (down 200,000), South Dakota (down 200,000), North Dakota (down 100,000), and Nebraska (down 100,000).
New seedings of alfalfa in the U.S. during 2016 totaled 2.3 million acres, down from 2.5 million acres in 2015. Wisconsin led the new seeding decline, down 120,000 acres from 2015.
Hay yield
The average U.S. dry hay yield (all types) rose modestly from 2.47 tons per acre in 2015 to 2.52 tons per acre in 2016. For alfalfa and alfalfa-grass mixtures, the average yield jumped from 3.32 tons per acre in 2015 to 3.45 tons per acre in 2016.
Arizona and California continued to dominate the average alfalfa yield category in 2016 notching 8.6 and 7.0 tons per acre, respectively.
Hay production
The 2016 production of all types in the U.S. totaled 134.8 million tons, up only 0.2 percent from 2015. Total alfalfa production declined by 1.2 percent down to 58.3 million tons.
In some states, alfalfa hay production was cut significantly in 2016 compared to 2015. Included in this group were South Dakota (down 780,000 tons), Iowa (down 693,000 tons), Colorado (down 490,000 tons), North Dakota (down 470,000 tons), and California (down 411,000 tons). In some cases, the lower production was caused by acreage reductions, others by reduced yield, and some a combination of both relative to 2015.
Significant alfalfa production gainers in 2016 were Minnesota (up 565,000 tons), Kansas (up 540,000 tons), and Oregon (up 420,000 tons).
In summary . . .
Keep in mind that hay and forage markets are driven by local and regional conditions that do not always follow national trends. Be it hay stocks, acreage, yield, or production, there are wide ranges among states.
Overall, U.S. year-over-year December 1 hay stocks in 2016 continued an upward trend but rose by a smaller amount than has been seen in the previous several years. Hay acres declined in 2016 driven largely by almost a million fewer alfalfa acres. Somewhat higher U.S. hay and alfalfa yields largely made up for the drop in acreage, though total alfalfa production dropped 1.2 percent from 2015.
Growing dairy and beef herds, better milk and beef prices, a strong hay export market, and fewer alfalfa acres, both established and new seedings, are signs that hay prices likely won’t retreat further in 2017 and probably will strengthen, at least modestly. As is almost always the case, Supreme and Premium hay will be in the shortest supply and bring highest price.
If you wish to dig a little deeper into the USDA numbers, hay and forage information can be found on pages 34 to 46 of the Crop Production Annual Summary report.