The author is the director of nutrition research and innovation with Rock River Lab Inc, and adjunct assistant professor, University of Wisconsin-Madison’s Dairy Science Department.
Do you know what actually goes into TDN (total digestible nutrients), RFV (relative feed value) or milk per ton values used to buy or sell hay or silage? Is the important nutrition component, fiber digestibility, included in the evaluation?
Feed value indices have evolved substantially over the past 30 years as numerous researchers have published and documented the impact NDFD (neutral detergent fiber digestibility) has upon animal performance, with greater NDFD measures corresponding to greater gains or milk per cow. Gaining two to three units in NDFD will often lead to 1 pound per cow improvement in performance.
As dairies and feedlots recognize performance variances from one crop to the next, in many cases due to NDFD, the industry’s search for better crop value measures intensified. As a result, crop value predictions have evolved to incorporate NDFD measures and improved in accuracy under the guidance of university researchers and professors. However, with all of this progress in understanding, too many conversations and transactions still center on forage measures that do not consider advanced nutrition NDFD.
Millions of dollars in hay and silage are bought and sold each year based upon quality values that do not reflect fiber digestion potential. Does the benchmark used to value forage consider appropriate nutrient measures or NDF digestibility within the ranking? In the following discussion and figures, an outline of how forage nutrient parameters (such as crude protein; CP) and NDFD are related to, and explain, common forage value measures.
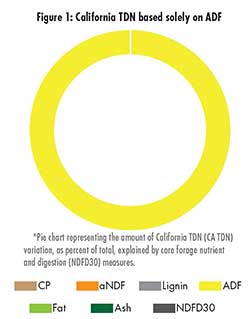
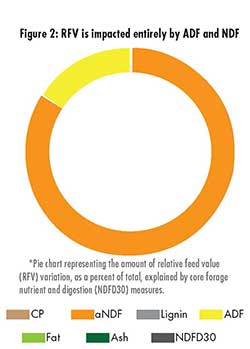
Fiber content matters and ADF is important. But while research-backed, ADF alone falls short of explaining many animal performance swings. As time has gone on, forage crop value estimates further evolved to incorporate another fiber measure, neutral detergent fiber (NDF), into RFV. The RFV measure added slightly more complexity, however it still simply represents only fiber content as evidenced in Figure 2. The hay or haylage NDF explains over 75 percent of RFV, while other nutrient measures, such as crude protein and NDFD, have no impact on RFV.
Further investigating the forage analysis measures that contribute to RFQ, NDF remains a large stake-holder, similar to RFV. However, crude protein (CP), fat, and ash are important forage nutrients to consider, and RFQ builds these in — meaning RFQ is more dynamic than RFV. The RFQ index not only builds these valuable nutrients into the equation, but further relates to animal performance by incorporating NDFD, which accounts for roughly 25 percent of the RFQ result (Figure 3).
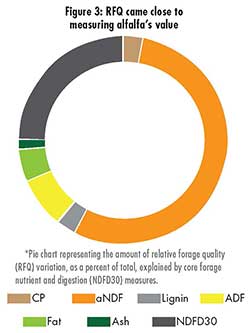
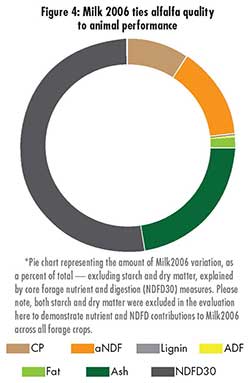
Greater NDFD will be reflected in higher RFQ values, other things being equal, and this is logical. The goal for RFQ should be 175 or greater for high performing dairy or beef cattle. While RFQ is applicable for hay and haylage, there is one more advanced quality ranking; the Milk2006 equation, which seeks to better relate to animal performance.
Develop a system
These pie charts are a visual representation of which forage analysis measures, and to what extent, are used to value forage with your favorite index. If your index seems overly simple, such as being based on a single nutrient or two, work with your consulting team to choose a new one that has potential to better reflect the quality of your forage for use on your own herd, or for marketing your forage to others. Consider using the more advanced quality rankings to more appropriately value your forage and better relate to animal performance.
Besides analyzing your forage value to build a great ration, the forage quality measure utilized on your farm or your clients’ farms can also hone a benchmarking program to continue to improve quality through the years. All of this can be done while the industry waits for history to repeat itself with new parameters for forage quality measurement that get us closer to knowing exactly what happens within the cow.
This article appeared in the March 2016 issue of Hay & Forage Grower on pages 40 and 41.
Not a subscriber? Click to get the print magazine.