USDA: There’s less hay |
| By Mike Rankin, Managing Editor |
|
|
|
The days of guessing about 2017 hay production and inventories have come to an end. On January 12, USDA released their Crop Production and Crop Production Annual Summary reports. Combined, they offer a glimpse of the current state of the forage industry and give us a basis as to how sensitive hay markets might be to various production pressures in 2018. December hay stocks The USDA makes its annual assessment of hay stocks in May and December. Last May, hay stocks declined for the first time in three years, settling at about 24.4 million tons after the winter-feeding season. Last week, USDA pegged December 1 hay stocks at 86.2 million tons, down 10 percent from one year ago. This was the first year-over-year decline in December stocks in four years and the lowest December stocks total since 2012 (see graph below).  As might be expected, individual states varied in the direction and amount of hay stocks (see table below). Of the major hay-producing states, the largest inventory declines occurred in drought-stricken North Dakota (down 28.7 percent), Texas (down 27 percent), North Carolina (down 26.7 percent), Oregon (down 26.1 percent), Washington (down 23.3 percent), Arizona (down 21.7 percent), and Louisiana (down 20.5 percent). Aside from North Dakota, a number of other Midwest states had significant stock reductions, including Minnesota (down 19.1 percent), Wisconsin (down 17.2 percent), Michigan (down 16.7 percent), Kansas (down 15.1 percent), Iowa (down 14 percent), and South Dakota (down 10.8 percent). Indiana and Ohio experienced inventory gains. In the West, California, Nevada, and New Mexico held steady with no change in year-over-year inventories. Colorado was up 6.1 percent and Wyoming was up 10.7 percent. Some of the Southeast states that experienced drought in 2016 were able to build back inventories in 2017. Alabama was up 47.6 percent and Georgia boosted its stocks by 30.5 percent. Bottom line: U.S. hay stocks on December 1 were down significantly. The ability to buffer weather-related production issues in 2018 is not as great as in recent years. 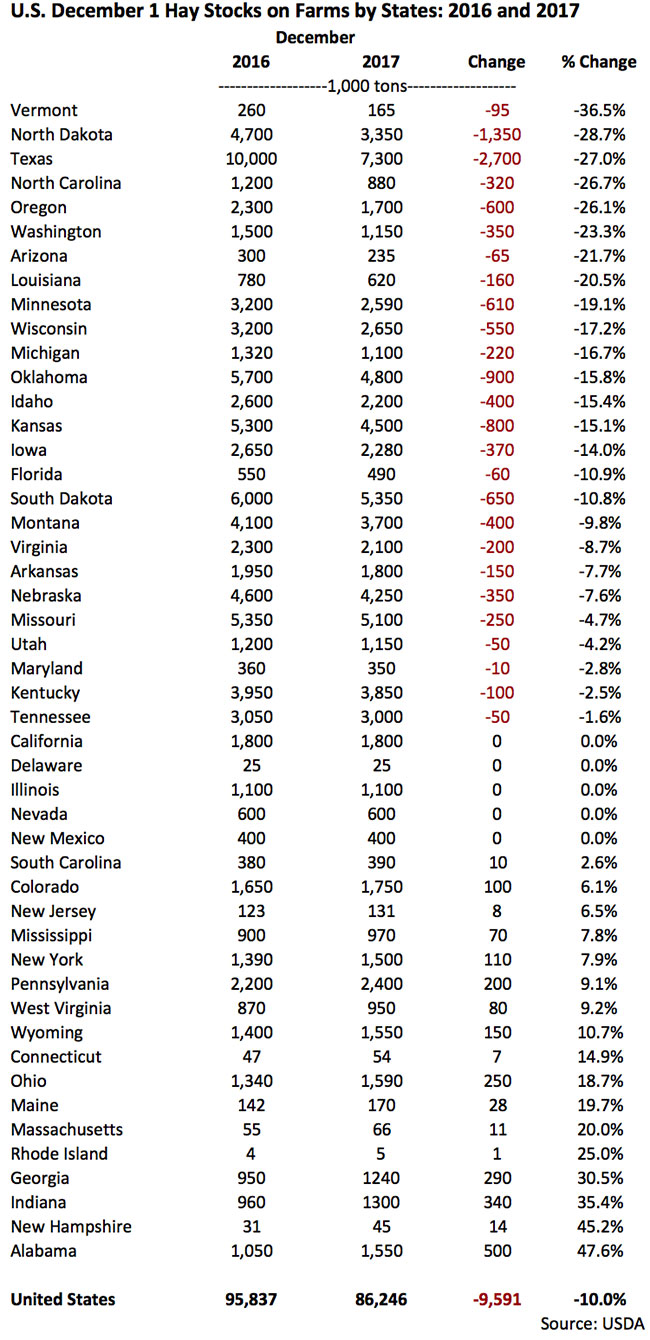 Harvested hay acres The forecasted harvested hay acreage for 2017 was pegged at 53.5 million last June, about the same as 2016. USDA’s January report set the final 2017 acreage at 53.8 million, slightly higher than 2016 but still about 663,000 acres less than 2015. The estimates only include acres that had at least one cutting harvested as dry hay. Acres of alfalfa and alfalfa-grass dry hay mixtures declined from 16.9 million in 2016 to 16.6 million in 2017. States with the largest harvested alfalfa acreage declines included Montana (minus 200,000 acres), South Dakota (minus 200,000), Wisconsin (minus 140,000), Kansas (minus 130,000), and Minnesota (minus 130,000). California was down 60,000 acres. Iowa led gainers with 170,000 more alfalfa acres than 2016. No other state had over 80,000 additional acres. When considering alfalfa acres harvested for all purposes (hay, haylage, and greenchop), Wisconsin topped the list of states in 2017 with 1.7 million acres. This was down from 1.95 million acres in 2016. South Dakota had the second most all-purpose alfalfa acres with 1.5 million. New alfalfa seedings New seedings of alfalfa and alfalfa-grass mixtures in the U.S. during 2017 totaled 2.21 million acres. This was down from 2.27 million acres in 2016 and 2.54 million in 2015. Hay yield The average U.S. dry hay yield (all types) dropped from 2.52 tons per acre in 2016 to 2.44 tons per acre in 2017. For alfalfa and alfalfa-grass mixtures, the average yield declined from 3.45 tons per acre in 2016 to 3.32 tons per acre in 2017. Arizona and California continued to dominate the average alfalfa yield category in 2017 notching 8.4 and 6.8 tons per acre, respectively. Both states were down 0.2 ton per acre from 2016. Hay production The 2017 production of all dry hay types in the U.S. totaled 131.5 million tons, down 2.6 percent from 2016. Total alfalfa hay production declined by 5.5 percent to 55.1 million tons. In some states, alfalfa hay production was cut significantly in 2017 compared to 2016. Included in this group were Kansas (down 958,000 tons), South Dakota (down 775,000 tons), Wisconsin (down 620,000 tons), California (down 552,000 tons), North Dakota (down 490,000 tons), and Minnesota (down 485,000 tons). In some cases, the lower production was caused by acreage reductions, others by reduced yield, and some a combination of both relative to 2016. Significant alfalfa production gainers in 2017 were Colorado (up 428,000 tons), New York (up 410,000 tons), and Pennsylvania (up 326,000 tons). In summary . . . All U.S. forage production metrics in 2017 tell a story of fewer acres, lower yields, and less production compared to 2016. The decline in year-over-year December 1 hay stocks is evidence of the production data. Even so, regional differences exist and none of the USDA data distinguishes for forage quality. The USDA reports lend evidence that hay prices will not decline in 2018 and possibly may strengthen, especially with any kind of widespread weather event such as alfalfa winterkill, excessive rainfall, or drought. As is almost always the case, Supreme and Premium hay will be in the greatest demand and the shortest supply. |
