Avoid buying hay based on noise |
| By John Goeser, David R. Mertens |
|
|
Editor’s note: This is the third of three columns by the authors who will attempt to address the many issues associated with putting a value on alfalfa hay and haylage. When marketing milk and managing risk with contracts or options, we never make decisions based upon a single event or day. Multiple data points, such as trends in cheese inventories, cattle numbers, exports, and other fundamentals, coupled with our experience in prior years, shape our risk tolerance and decision to buy or sell. Randomness truly exists, so we cannot eliminate all variation. Yet, we can identify the randomness and noise with multiple data points, and just like with commodity marketing, we can make more informed decisions when buying hay or haylage. In any single hay or haylage analysis report, there is some inherent noise. This is not well understood by buyers or sellers. Your agribusiness can take risk out of the hay buying and selling process by understanding and accounting for the noise associated with a single hay test. Consider the following case study as one example of a fairly routine experience for many. Uncovering the noise Some variation is explainable, and we can vary techniques to control it. The accompanying table represents eight different hay test results from the same hay lot over a two-week period. Here, a farmer and nutritionist sent in four different samples over time, and then the laboratory analyzed each sample twice. This table showcases sampling noise (from the farm) and subsampling noise (at the lab). In this example, both the farmer and the lab did a good job, yet there is still variation. Using statistics, we describe variation as a standard deviation, but this is not commonly understood. Another measure of variation that may be easier to understand is the “range” in data. The range is the difference between the maximum and minimum measurement. Typically, the range is about three times the standard deviation. In this case, the range in acid detergent fiber (ADF) is 5 (32 to 27); for neutral detergent fiber (NDF), it is 8 (38 to 30); for California total digestible nutrients (CA TDN), it is 3.8 (62.1 to 58.3); and for relative feed value (RFV), it is 50 (210 to 160). It’s important to separate the variation in this real farm example. Here, the range in ADF and NDF deviates roughly 5 and 8 percentage units, respectively, between Samples 1 through 4; however, the range in the lab level replicates deviates roughly 0 to 3 units for both ADF and NDF. What does this mean? In this example the greater variation comes from the farm, and we’ve seen this play out over and over in our experience. Multiplying the noise While the laboratory fiber measures contain some noise, hay grade calculations can multiply the noise. For the hunters out there, think of this issue like how a poorly sighted-in rifle may only be 1 inch from center at 50 yards, but, when shooting to 200 yards, the miss could be off the paper entirely. In the example, using ADF to determine CA TDN actually reduced the range from 5 to 3.7 percentage units. Yet using both ADF and NDF, which have ranges of 5 and 8, to calculate RFV creates a range of 50. This could equate to a $50 per ton difference and over $1,000 deviation for a truckload of hay. When working with the consultant for the farm in this example, this seemed to be far too much noise in the tests — but this is real, and it was eye opening for us all. This example shows that it is impractical to expect that RFV will have the same variation or range as the fiber measures. The RFV calculation creates a mathematical artifact. In the first article of this three-part series, we discussed how hay grades are calculated and described complications associated with these grades. For more insight into the calculations and limitations, refer back to the April/May issue of Hay & Forage Grower. One interesting point here is that the relative range (or coefficient of variation, which equals range divided by the mean) is affected less by the calculation because both the average and the range increase. The relative range for ADF is 17.5% (5/28.6), NDF is 23.5% (8/34), and RFV is 27.3% (50/183). 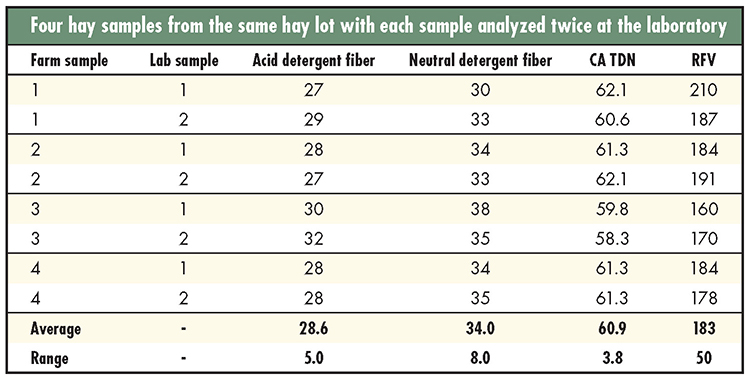 Accounting for noise To compensate for noise, analyze multiple samples and average the results. Averaging replicates always gives a better measure for the true value of the stack, lot, bunker, or load. This is why we preach that sampling more bales for single samples and more samples for the truckload or stack. This replication comes at added sampling costs, but multiple sample results can then be averaged to come to a more accurate conclusion. Think of this like shooting several times to grasp where your scope is sighted in; we never shoot just once and make a judgment. This effect is demonstrated from the table data. Every time we average more replicates together, the variation among the averages is reduced. In statistical terms, we can reduce the variation by the square root of the total replicate number used to calculate the average. This may sound confusing, but if we average each of the lab replicates for NDF in the table, we get 31.5, 33.5, 36.5, and 34.5. Now the observed range is 5 units, compared to 8 units before. We can use this concept to reduce the risk in pricing hays. The moral to this story is to use multiple different samples to drive your decisions and recognize the farm level sampling noise phenomena is real. Bill Weiss and Normand St-Pierre at The Ohio State University have written numerous research papers that confirm this concept. Take this discussion up with your hay broker, clients, and agronomy or nutrition consultants involved in the process. Understand and account for the noise in your hay samples and your buying decisions will become clearer. This article appeared in the November 2020 issue of Hay & Forage Grower on pages 30 and 31. Not a subscriber? Click to get the print magazine. |