Cows don’t necessarily need alfalfa or corn silage — they need energy, fiber, and protein. Forages with greater concentrations of these nutrients are ultimately more valuable to animals; however, the indexes and metrics used to quantify forage quality don’t account for each component as accurately as they should.
As a pioneer of forage quality metrics, relative feed value (RFV) measures acid detergent fiber (ADF) and neutral detergent fiber (NDF). The total amount of fiber is inversely related to forage quality, but it fails to consider fiber as an essential nutrient that is critical for milk production and rumen health.
Since its inception, relative forage quality (RFQ) has pushed RFV to the backseat. The former metric includes total digestible nutrients (TDN) and neutral fiber digestibility (NDFD), which better represent the feed value of forage. That said, RFQ is still negatively correlated with forage fiber content, and protein is not directly factored into the equation.
Relative forage quality also does not incorporate economic factors like milk price and the price of nutrients into its calculation. These numbers vary by region and over time, which can affect how farmers utilize forage and determine how valuable the ingredient is to them. And although RFQ is comparable among grasses and legumes, it was not developed to measure corn silage quality.
There’s another way
On the World Dairy Expo Dairy Forage Seminar stage, Bill Weiss outlined a more comprehensive approach to gauge forage quality. The emeritus professor of dairy nutrition at The Ohio State University created a system that accounts for economically important forage nutrients, the value of these nutrients, the effect of fiber on feed intake, and local milk price.
Weiss’s equation includes NDF, net energy for lactation (NEL), and metabolizable protein (MP) on a dry matter basis. A key difference in his calculations is that both the positive and negative aspects of NDF are included.
“On average, a pound of NDF has half the energy of a pound of starch, so as fiber goes up, starch goes down, and energy goes down. Fiber also fills up cows. If you feed a lot of fiber, cows eat less and they produce less milk,” Weiss stated. “There are a lot of reasons to treat forage fiber as a negative, but it is a required nutrient for ruminants. If you don’t feed enough of it, you’re going to have sick cows. You will have less milkfat,” he contended.
While NDF and NEL are readily available on most forage analyses, MP must be calculated as a percent of crude protein. “Metabolizable protein is the amino acids that are absorbed by the intestines in the cow,” Weiss explained. “Protein can be divided into rumen degradable protein (RDP) and rumen undegradable protein (RUP). Since forages are high in RDP, we have to discount for that. To estimate MP% of alfalfa, you multiply CP% by 0.56.”
The next step is to multiply the concentration of each nutrient by its estimated price. For example, consider alfalfa that is 88% dry matter and has 0.69 Mcal per pound, 39% NDF, and 23% CP or 12.9% MP (23% x 0.56). After converting these numbers to amount per ton — 1,214 Mcal, 686 pounds NDF, and 227 pounds MP — they can be multiplied by estimated nutrient values to determine cost per ton. If energy is $0.104 per Mcal, NDF is $0.075 per pound, and MP is $0.50 per pound, the total value for this alfalfa would be $290 per ton (Table 1).
Weiss uses a software program called Sesame that was developed at The Ohio State University to estimate feed prices, although regional feed prices are available and updated by other organizations. Either way, the total value should be considered within a range of plus or minus 10% because of statistical uncertainty.

Adjust for digestibility
The math doesn’t stop there. Forage fiber must be further adjusted for IVNDFD before it can be used to determine overall feed value. Weiss noted producers can use NDFD30 or NDFD48 for this calculation as long as the metrics are consistent within a comparison. Since feed intake and milk production are associated with a change in IVNDFD, it must be compared to a standard. Reasonable standards for IVNDFD48 for alfalfa, corn silage, and grasses are 49%, 52%, and 64%, respectively.
Continuing with the above example, if the sample of alfalfa had 55% NDFD48, it would have six units better digestibility than the standard 49% NDFD48. A one-unit improvement in IVNDFD equals 0.5 more pounds of milk and 0.3 more pounds of feed intake per day. Therefore, a producer could expect cows to produce 3 more pounds of milk (0.5 x 6) and consume 1.8 more pounds of forage (0.3 x 6) per day when feeding this alfalfa. To determine income over feed costs, Weiss provided a table of constants to simplify cost adjustments for different feed and milk prices (Table 2).
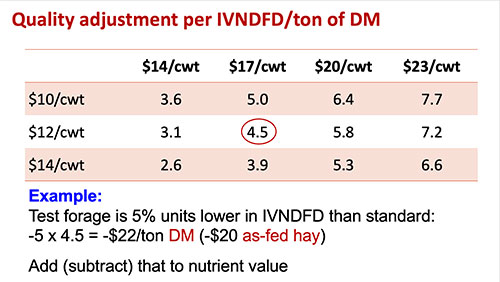
Multiply the difference between IVNDFD and the standard by the quality adjustment factor and add this number to the original cost of forage. This will offer a baseline for an acceptable price range of feed.
“As feed prices go up, the value of quality goes down. It remains positive, but it still goes down,” Weiss said. “As milk prices go up, the value of quality becomes worth more. At high milk prices, quality has a significant bonus. High feed prices still bring a bonus, but it’s not as strong.”
Weiss made his calculations assuming a forage inclusion rate of 22 pounds; however, he noted this method may overvalue forage quality in dairy rations that contain lower inclusion rates. Another limitation to this approach is that it figures changes in fiber digestibility will have the same effect on all cows when higher-producing cows may be more responsive to forage quality. It also assumes feed is ensiled properly and cannot be used to justify the quality of moldy forage.