If you’re one of those hay producers who has stuck it out through a period of lower prices, take heed because times are changing.
On the heels of USDA’s Prospective Plantings report that predicts somewhat lower hay acreage being harvested in 2018, the most current Crop Production report pegged U.S. May 1 dry hay stocks at a whopping 36 percent, or 8,719 million tons, below one year ago.
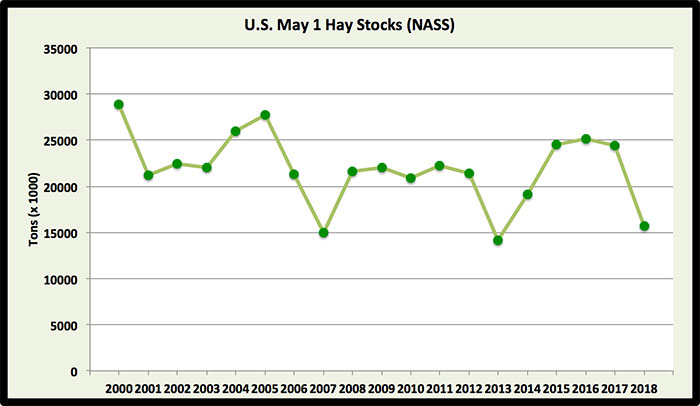
At 15.67 million tons, May 1 hay stocks sit at their lowest point since 2013, a year that followed a widespread U.S. drought and posted a May 1 stocks number of 14.16 million tons. This year’s May 1 hay inventory ranks as the third lowest in this century (see graph) and one of the lowest since 1950.
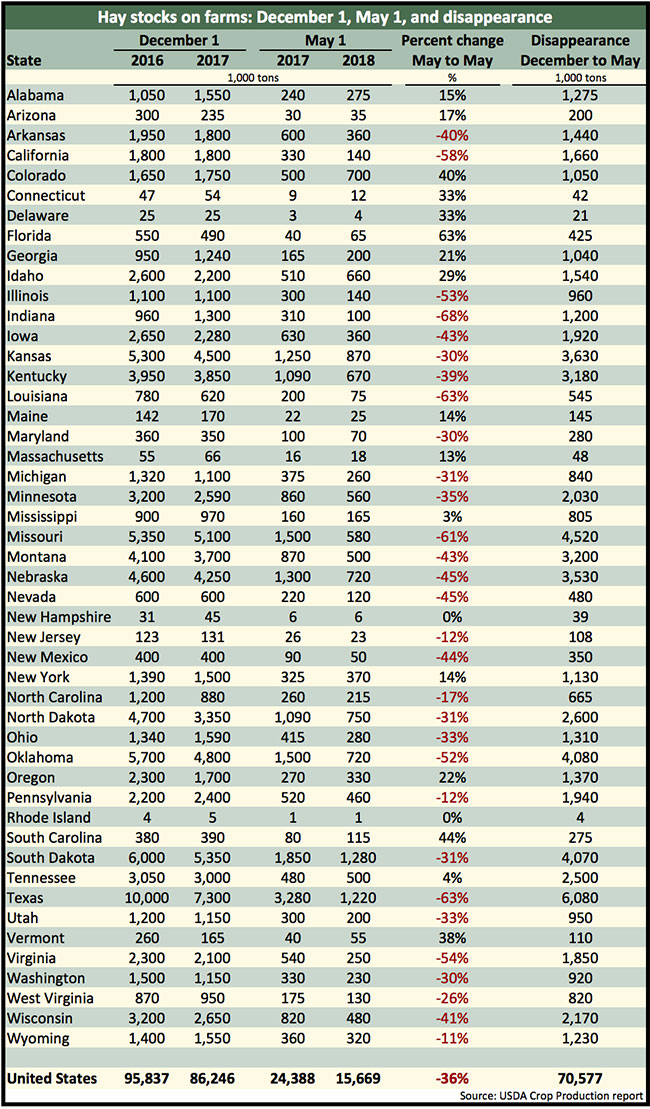
Some of our largest hay-producing states had year-over-year May 1 stock reductions much greater than the U.S. average (see table). Falling into this group were Texas (down 63 percent), Missouri (down 61 percent), California (down 58 percent), Oklahoma (down 52 percent), Nebraska (down 45 percent), Iowa (down 43 percent), Montana (down 43 percent), Wisconsin (down 41 percent), and Kentucky (down 39 percent).
Southeastern states appeared to have fared the best in terms of building hay inventories. Florida, South Carolina, Georgia, Alabama, Tennessee, and Mississippi all showed gains in year-over-year May 1 hay stocks. Some western states also had improved hay inventories. These included Colorado, Idaho, Oregon, and Arizona.
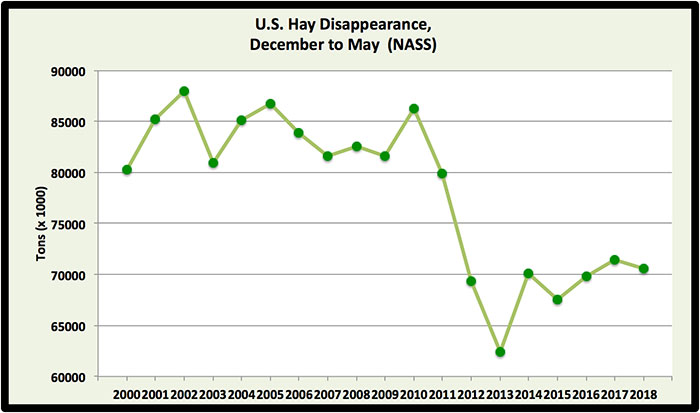
Hay disappearance between December 1, 2017, and May 1, 2018, totaled 70.6 million tons. This number was down slightly from a year ago but in line with disappearance figures seen during the past five years (see graph). Recall that December 1, 2017, dry hay stocks were down about 10 percent, or 9,591 million tons, from the previous year.
So what’s going on?
No single factor can be attributed to the drop in hay stocks, but many factors have certainly contributed. According to USDA, about 3.54 million tons less hay was produced in the U.S. during 2017 than the previous year. That accounts for 41 percent of the year-over-year difference in May 1 stocks.
Since hay disappearance (feeding) doesn’t appear to have changed dramatically in recent years, we can probably assume that carryover dry hay inventories from previous years are being moved or fed. This for sure occurred in 2017 when we saw a big drop in December 1 stocks that couldn’t be accounted for by slightly lower hay production.
Why the need for feed?
The answer probably varies for different regions of the country. The nation’s beef cow herd has been steadily building back after a big sell-off following 2011 and 2012 droughts. The collective dairy herd has also been on the rise.
During the past couple of years, the U.S. has experienced a plethora of environmental calamities, including droughts, hurricanes, excessive rain events, and wildfires. Though often regional in nature, collectively these all have had an impact on hay production, demand, and use.
Another factor, primarily affecting Western states, is the rise in hay exports during the past couple of years. This has direct implications on available hay inventories and prices.
A majority of the hay crop grown in the Midwest and Northeast has long been harvested as haylage. This inventory is not included in the USDA hay stock estimates.
One factor that has changed recently is the rapid adoption of baleage in the humid regions of the U.S., including the Southeast. Like chopped haylage, baleage is also not included in the inventory estimates but both still comprise a significant portion of the nation’s feed reserves.
The trend in higher prices over the past year mirrors what is happening with hay stocks. That’s good news if you’re still in the hay-selling business and not such great news if you’re a livestock owner who routinely purchases hay. Anything less than an average production season in 2018 will no doubt send hay prices even higher than current levels.