No surprise: 2021 hay production was down |
| By Mike Rankin, Managing Editor |
|
|
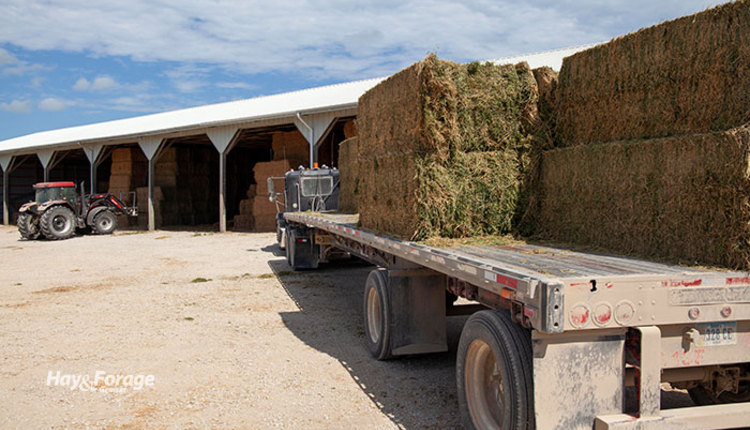 The annual release of hay and forage data by USDA that defines the previous year’s hay production and year-ending inventories arrived in email inboxes last Thursday. The Crop Production and Crop Production Annual Summary reports offer a glimpse of the current state of the forage industry and provide a gauge to measure hay market sensitivity to various production pressures in 2022. Overall, virtually all forage production metrics were down in 2021 compared to the previous year — even corn silage production. In the case of many states, drought was the reason that forage production suffered. This caused a reshuffling of state rankings for both hay and haylage production. Here’s a deep dive into the numbers. December hay stocks The USDA makes its assessment of dry hay stocks in May and December of each year. Last May, spring hay stocks declined by a little over 2.4 million tons compared to the previous year. USDA pegged December 1, 2021, hay stocks at about 79 million tons, down 5 million tons (6%) from a year ago. This puts stocks at essentially the same place they were in December 2018. Of course, they are far below the levels seen during the first 10 years of the decade. 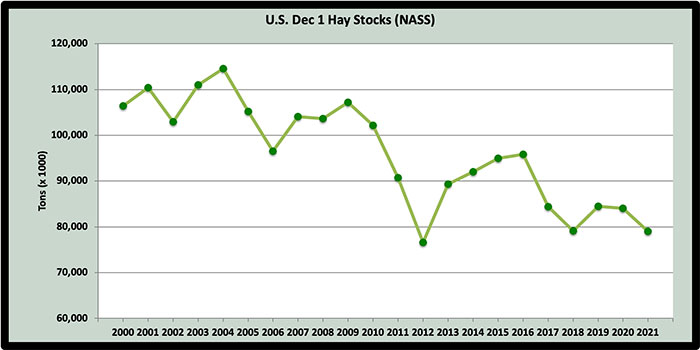 As might be expected, individual states varied in the total amount and direction of hay inventory change (see table below). Of the major hay-producing states, the largest inventory reductions occurred in those that have been hit hard by drought: North Dakota – down 43.3% South Dakota – down 43.1% Oregon – down 42.5% Arizona – down 40% Montana – down 39.6% Minnesota – down 34.8% Some states had significant inventory gains. These included: New York – up 70% Iowa – up 28.4% Texas – up 28.1% Nevada – up 22.5% Michigan – up 22.2% Colorado and Wisconsin – up 17.6%  Bottom line: The lower December hay stocks come as no surprise; it was just a matter of to what degree. Overall, the level of U.S. December 1 hay stocks has dropped over 15 million tons since 2016. At the same time, the U.S. has also experienced a significant decline in the amount of dry hay disappearance between December and the following May. Currently, both dairy and beef cow numbers are in decline. Regional differences in hay supplies almost always exist, and high-quality hay is generally in the shortest supply even when overall inventories appear adequate. Current inventories will continue to support historically high hay prices. Also, keep in mind that these inventory numbers do not account for hay stored as higher moisture haylage. Harvested hay acres USDA’s Crop Production Annual Summary set the final 2021 harvested hay acreage at 50.7 million, which was 3% fewer acres than the previous year. The estimate only includes acres that had at least one cutting harvested as dry hay. Once again, Texas led the nation with a little over 5.6 million dry hay acres in 2021 and was followed by Missouri (3.14 million acres) and Oklahoma (2.95 million acres). South Dakota lost 650,000 dry hay acres in 2021 and fell from third place in 2020 to sixth last year. Harvested acres of alfalfa and alfalfa-grass dry hay mixtures in the U.S. declined by 6% to 15.25 million, which was a loss of nearly 1 million acres. The top three states for alfalfa dry hay acres harvested in 2021 were Montana (1.55 million), South Dakota (1.3 million), and Idaho (0.96 million). South Dakota had the largest reduction of harvested alfalfa acres in 2021 at 500,000. Another drought state, Montana, followed behind with a loss of 350,000 alfalfa acres while North Dakota dropped by 300,000 acres. Top acreage gainers in 2021 included Kansas (up 150,000), Colorado and Iowa (both up 80,000), and Illinois and Wisconsin (both up 70,000). Seventeen states report forage production data with all harvest methods included (hay, haylage, and greenchop). When considering alfalfa acres harvested for all purposes, Wisconsin regained the top position from South Dakota with 1.8 million acres of alfalfa harvested. South Dakota came in second with 1.3 million acres of alfalfa and was followed by Idaho with a little over 1 million acres. New alfalfa seedings New seedings of alfalfa and alfalfa-grass mixtures in the U.S. during 2021 totaled 1.65 million acres. This was 538,000 fewer acres than 2020. Wisconsin easily had the highest number of new seeding acres at 300,000, which was still 100,000 fewer than 2020. Aside from Wisconsin, only two other states had new seeding alfalfa acres totaling 100,000 or more in 2021 — Idaho and Michigan. Hay yield The average U.S. dry hay yield (all types) declined from 2.43 tons per acre in 2020 to 2.37 tons per acre in 2021. For alfalfa and alfalfa-grass mixtures, the year-to-year average yield dropped from 3.27 tons per acre to 3.23 tons per acre. Arizona and California continued to dominate the average alfalfa yield category in 2021, notching 8.3 and 7.4 tons per acre, respectively. Looking at the 17 states that report all harvest methods, alfalfa yields on a dry equivalent basis were 3.69 tons per acre, up 0.07 tons from 2020. Among these 17 states, only South Dakota at 1.53 tons per acre has a yield of under 3 tons of dry equivalent forage. Hay production The 2021 production of all dry hay types in the U.S. totaled 120.2 million tons, down 5.2% from 2020. South Dakota, North Dakota, and Montana all had year-over-year total hay production reductions of about 40%. Some states, such as New York and Colorado, had significant production gains over the previous year. Total alfalfa dry hay production was pegged at 49.2 million tons, 7.2% below the previous year but slightly above earlier estimates. In some states, alfalfa hay production was cut significantly in 2021 compared to 2020. Included in this group are: Montana – down 1,545,000 tons North Dakota – down 1,368,000 tons South Dakota – down 1,290,000 tons Minnesota – down 922,000 tons Idaho – down 609,000 tons Wyoming – down 575,000 tons In all cases, the lower production was caused by reductions in both acres and yield relative to 2020. Significant dry alfalfa hay production gainers in 2021 were led by: Colorado – up 740,000 tons Kansas – up 486,000 tons Nebraska – up 463,000 tons Nevada – up 301,000 tons Interestingly, when only looking at the 17 states reporting all harvest methods, alfalfa production was up slightly in 2021 compared to the previous year. Wisconsin, for example, was up by 855,000 tons or over 14%, fueled by higher acres and yields compared to the previous year. Iowa, Kansas, Nebraska, and California also posted significant total production gains. Corn silage Corn silage production in the U.S. has been on a steady climb, but production in 2021 declined due to a drop in both acres and yield. Corn silage acres dropped from 6.71 to 6.48 million last year. The average U.S. yield declined from 20.5 to 20.1 tons per acre. Combined, these factors resulted in a final 2021 corn silage production total of 130.3 million tons, down 7.4 million tons or 5% from the previous year. As it always does, Wisconsin easily led the nation in 2021 corn silage production with 19.14 million tons produced from 890,000 acres. However, this acreage was down 70,000 from the previous year. Idaho topped the yield chart in 2021 with an average mark of 29 tons per acre. Arizona and California followed closely behind at 28 tons per acre. In summary . . . In 2021, most U.S. hay acreage, yield, and production metrics were marginally or significantly lower when compared to the previous year. Depleted hay inventories in many states caused by lower production will continue to bolster historically high hay prices. States in the upper Great Plains were hit especially hard by drought for the second year in a row and production figures reflect huge losses in hay production. U.S. dry hay production hit its peak in 1999 when 159.6 million tons were produced. Since that time, a slow but steady production decline has taken place, despite higher yields. In addition to producing less dry hay, we are also utilizing smaller amounts through the winter months. The growing popularity of higher moisture hay packages such as baleage might play a factor as well. Hay markets are generally regional in scope. From these USDA reports, it is easy to see that there was a wide state-level range of production gains and declines compared to the previous year. Extreme weather events are becoming more common, and virtually all of these are localized. In addition to regional weather extremes, there are also localized market factors. For example, in the West, hay exports often help to dictate market prices. In other areas, strong equine markets do the same. If you’d like to look deeper into the numbers for your specific state, access USDA’s Crop Production Annual Summary.
|