The annual slug of hay and forage data that defines the previous year’s hay production and year-ending inventories arrived in inboxes last Friday. The USDA’s Crop Production and Crop Production Annual Summary reports offer a glimpse of the current state of the forage industry and provide a gauge to measure hay market sensitivity to various production pressures in 2020.
Given the many weather struggles in 2019 that made it difficult to put forage in barns and silos, we might expect a dramatic downturn in yields and production. But that simply wasn’t the case based on the USDA data. Let’s dive into the numbers.
December hay stocks
The USDA makes its assessment of dry hay stocks in May and December of each year. Last May, spring hay stocks declined for the second year in a row, though not as dramatically as in 2018.
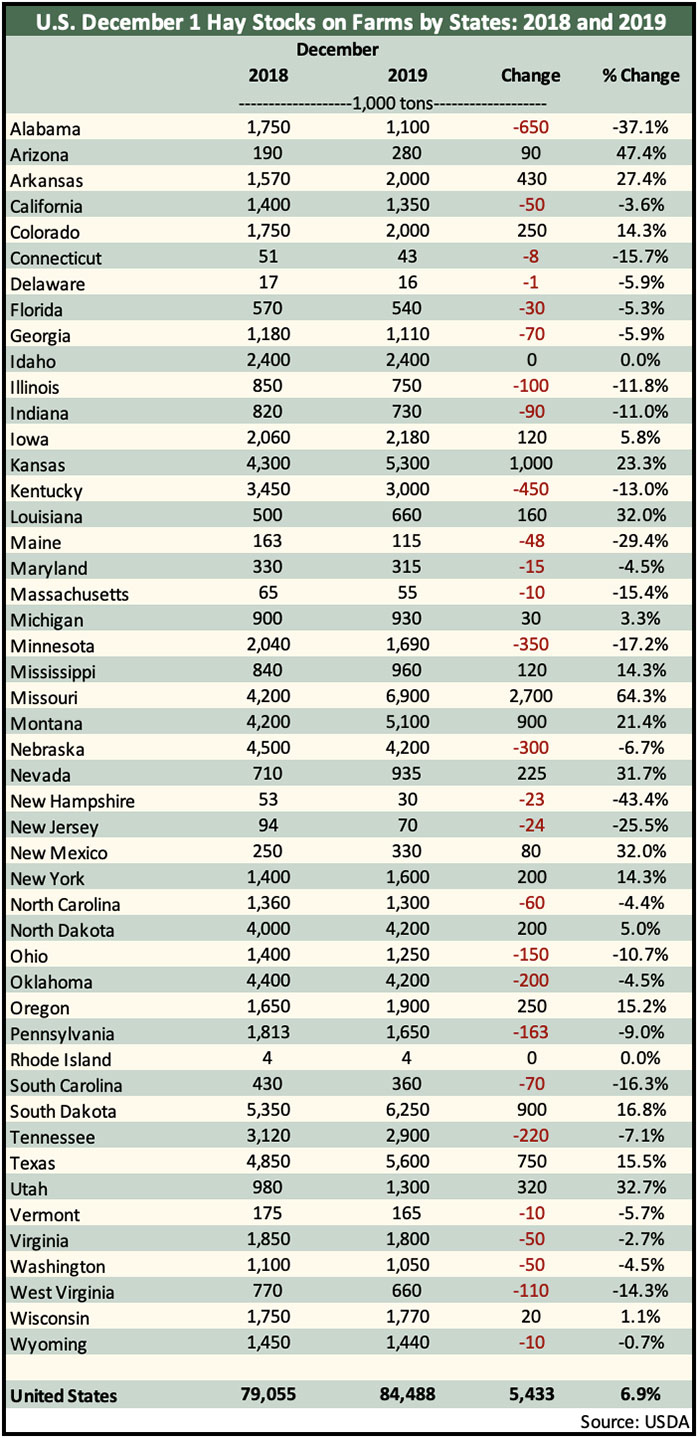
Last week, USDA pegged December 1, 2019, hay stocks at 84.5 million tons, up 5.4 million from a year ago and nearly the same inventory as December 2017.

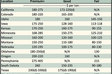
As might be expected, individual states varied in the total amount and direction of hay inventory change (see table below). Of the major hay-producing states, the largest inventory reductions occurred in these states:
Alabama – down 37.1%
Minnesota – down 17.2%
Kentucky – down 13%
Illinois – down 11.8%
Indiana – down 11%
Ohio – down 10.7%
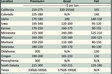
Many states had significant inventory gains. These included:
Missouri – up 64.3%
Utah – up 32.7%
Nevada – up 31.7%
Arkansas – up 27.4%
Kansas – up 23.3%
Montana – up 21.4%
Bottom line: The level of U.S. December 1 hay stocks has dropped about 10 million tons since 2016. At the same time, the U.S. has also experienced a significant decline in the amount of dry hay disappearance between December and the following May. Regional differences in hay supplies almost always exist, and high-quality hay is generally in the shortest supply even when overall inventories appear adequate.
Harvested hay acres
USDA’s Crop Production Annual Summary set the final 2019 harvested hay acreage at 52.4 million, which was about 400,000 acres fewer than 2018. The estimates only include acres that had at least one cutting harvested as dry hay.
Texas led the nation in 2019 with 4.92 million hay acres and was followed by Missouri (3.36 million acres) and South Dakota (3.35 million acres).
Harvested acres of alfalfa and alfalfa-grass dry hay mixtures climbed slightly from 16.6 million in 2018 to 16.74 million in 2019.
The top three states for alfalfa dry hay acres harvested in 2019 were Montana (2.1 million), South Dakota (1.9 million), and North Dakota (1.2 million).
North Dakota easily had the largest reduction of harvested alfalfa acres in 2019 at 250,000. Acreage gainers included Montana (plus 200,000), South Dakota (plus 150,000), and Nebraska (plus 100,000).
When considering alfalfa acres harvested for all purposes (hay, haylage, and greenchop), South Dakota holds the top position with 2 million acres. Wisconsin followed with 1.68 million acres while Idaho had the third largest acreage at 1.06 million.
New alfalfa seedings
New seedings of alfalfa and alfalfa-grass mixtures in the U.S. during 2019 totaled 2.47 million acres. This was 248,000 acres more than 2018. Wisconsin accounted for 170,000 of those additional new alfalfa seeding acres compared to the previous year.
Hay yield
The average U.S. dry hay yield (all types) jumped from 2.34 tons per acre in 2018 to 2.46 tons per acre in 2019. For alfalfa and alfalfa-grass mixtures, the year-to-year average yield improved from 3.17 tons per acre to 3.28 tons per acre.
Arizona and California continued to dominate the average alfalfa yield category in 2019, notching 8.3 and 7.1 tons per acre, respectively.
Hay production
The 2019 production of all dry hay types in the U.S. totaled 128.86 million tons, up 4.3 percent from 2018. Total alfalfa dry hay production also increased by 4.3 percent to 54.88 million tons.
In some states, alfalfa hay production was cut significantly in 2019 compared to 2018. Included in this group were North Dakota (down 303,000 tons), Texas (down 208,000 tons), California (down 160,000 tons), Ohio (down 128,000 tons), and Illinois (down 125,000 tons). In some cases, the lower production was caused by acreage reductions, others by reduced yield, and some a combination of both relative to 2018.
Significant alfalfa hay production gainers in 2019 were easily led by South Dakota (up 702,000 tons). This is the second year in a row that South Dakota has led production gainers. Since 2017, the Mount Rushmore State has increased its alfalfa hay acres by 350,000 and boosted its average yield by 0.6 tons per acre.
Other states with significant gains in alfalfa hay production in 2019 included Montana (up 620,000 tons) and Kansas (up 385,000 tons).
In summary . . .
In 2019, virtually all U.S. acreage, yield, and production metrics were at least marginally higher when compared to the previous year. The one exception was a slight reduction in total hay acres, which was driven by a smaller number of hay acres that were not alfalfa.
U.S. dry hay production hit its peak in 1999 when 159.6 million tons were produced. Since that time, a slow but steady production decline has taken place, despite higher yields. In addition to producing less dry hay, we are also utilizing smaller amounts through the winter months. The growing popularity of higher moisture hay such as baleage might play a factor as well.
Hay markets are generally regional in scope. From these USDA reports it is easy to see that there was a wide state-level range of production gains and declines compared to the previous year. Extreme weather events are becoming more common, and virtually all of these are localized.
In addition to regional weather extremes, there are also localized market factors. For example, in the West, alfalfa exports often help to dictate market prices. In other areas, strong equine markets do the same.