The annual release of hay and forage data by USDA that defines the previous year’s hay production and year-ending inventories arrived in email inboxes last Friday. The Crop Production and Crop Production Annual Summary reports offer a glimpse of the current state of the forage industry and provide a gauge to measure hay market sensitivity to various production pressures in 2024.
It's been a couple of years since U.S. forage production metrics were largely positive, but that streak has ended with only a few exceptions. As is usually the case, individual states performed in concert with the type of weather experienced. Many Western states improved their hay production after suffering through several drought years while some Midwest states assumed the drought-stricken role and their production was down accordingly. Let’s take a look into the numbers:
December hay stocks rebound
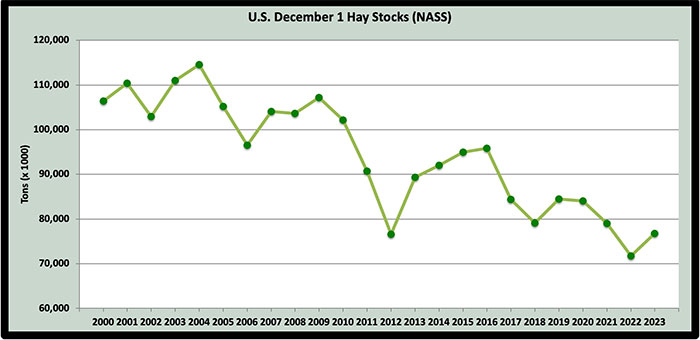
The USDA makes its assessment of dry-hay stocks in May and December of each year. Lately, we’ve been on a run of lower year-over-year stocks both in May and December. Last May, spring hay stocks declined 13%, or about 2.2 million tons compared to the previous year.
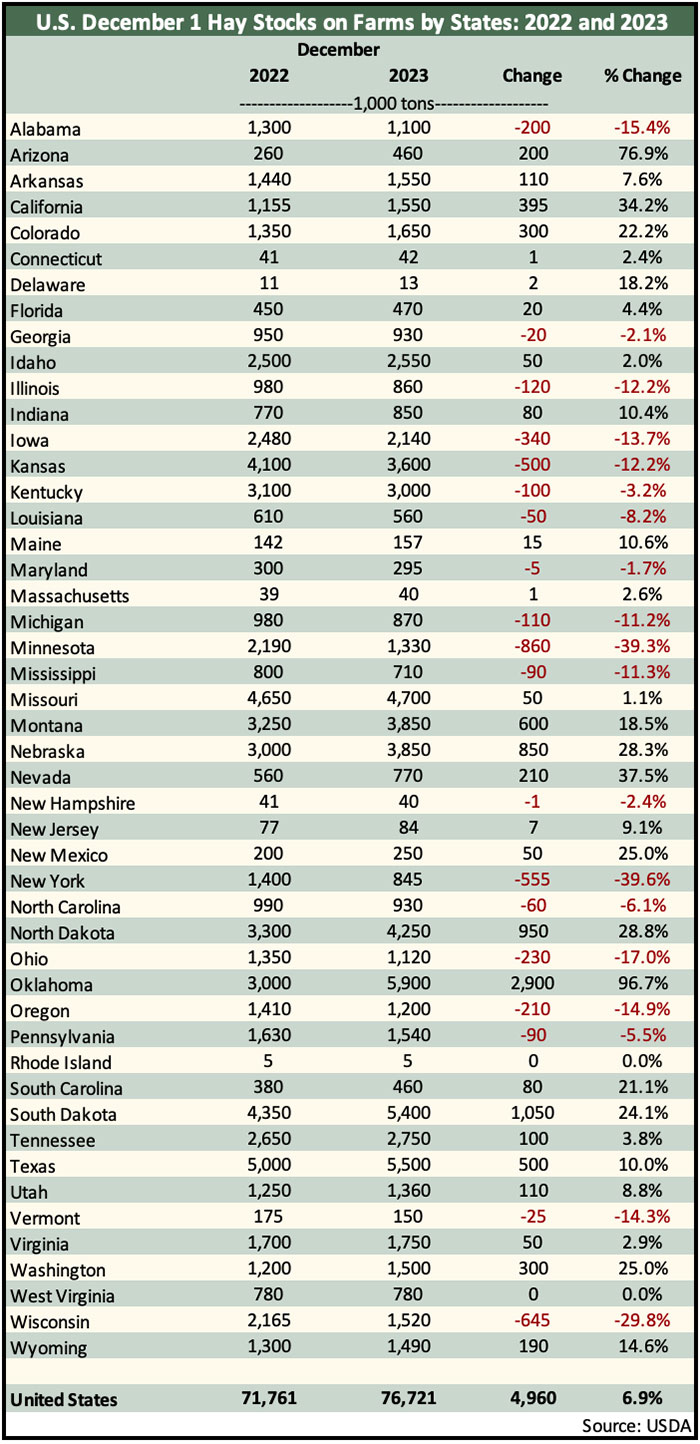
USDA pegged December 1, 2023, hay stocks at about 76.7 million tons, which was up nearly 5 million tons (7%) from a year ago. Hay stocks are still historically low, but the down trend from the past several years has at least been temporarily reversed.
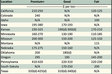
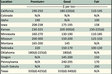
As is always the case, individual states varied in the total amount and direction of year-over-year hay inventory change (see table below). Of the major hay-producing states, most of the largest inventory reductions occurred in the Midwest, which was hit hard by drought in 2023 but had good production years in 2022. The largest reductions were seen in:
New York – down 39.6%
Minnesota – down 39.3%
Wisconsin – down 29.8%
Ohio – down 17%
Some states had significant inventory gains. These included several states that experienced serious drought in 2022 but had improved conditions in 2023:
Oklahoma – up 96.7%
Arizona – up 76.9%
Nevada – up 37.5%
California – up 34.2%
Bottom line: The higher December hay stocks were largely expected with more water available in the Western states. Further, hay exports have been down this year, which translates to more hay in storage. Still, the level of U.S. December 1 hay stocks is at a level that is nearly 7.8 million tons lower than 2019 and over 19 million tons behind 2016. In recent years, the U.S. has also experienced a significant decline in the amount of dry-hay disappearance between December and the following May.
Regional differences in hay supplies almost always exist, and high-quality hay is generally in the shortest supply even where overall inventories appear adequate. This is especially true this year. Present-day inventories will continue to support the current level of hay prices, which are significantly lower than one year ago. Keep in mind that these inventory numbers do not account for hay stored as higher moisture chopped haylage or baleage.
Hay production
The USDA’s Crop Production Annual Summary pegged 2023 production of all dry-hay types at nearly 118.8 million tons, which was up 6.2% from 2022. Oklahoma nearly doubled its production from 2022 with an 88% boost in year-over-year hay output. Texas hay production rose 44% in 2023 while South Dakota posted a 35% increase.
New York, Minnesota, Wisconsin, and Vermont all had year-over-year total hay production reductions between 20% to 30% to lead those states with lower output in 2023.
Total alfalfa dry-hay production in the U.S. was pegged at 49.9 million tons in 2023, 2.2% above the previous year. In some states, alfalfa hay production was cut significantly in 2023 compared to 2022, although reductions were nowhere close to what was seen in 2022. Leading the reduction group were:
Wisconsin – down 752,000 tons
California – down 336,000 tons
Pennsylvania – down 306,000 tons
Minnesota and Iowa – down 301,000 tons
Significant dry alfalfa hay production gainers in 2023 were led by:
South Dakota – up 1,133,000 tons (and up over 2 million tons from 2021!)
Montana – up 533,000 tons
Colorado – up 441,000 tons
Nebraska – up 379,000 tons
North Dakota – up 378,000 tons
When all alfalfa harvest methods are considered (dry hay, haylage, and greenchop), Idaho captured the lead spot with 5.25 million tons produced in 2023. The former leader, Wisconsin, barely edged out South Dakota for the second spot in alfalfa production with 4.21 million tons. South Dakota checked in with 4.18 million tons while California posted a final production total of 3.6 million tons.
Harvested hay acres
The USDA set the final 2023 harvested hay acreage (all types) at 52.8 million, which was 8.4% more acres than the previous year. The estimate only includes acres that had at least one cutting harvested as dry hay.
Once again, Texas led the nation with nearly 4.7 million dry-hay acres in 2023, which was up over 20% from 2022. Oklahoma rebounded from its dry previous year with 4.1 million acres to post the second most hay acres harvested and was followed by Missouri (3.8 million acres). South Dakota harvested over 2.9 million acres to assume the fourth position.
Drilling down, harvested acres of alfalfa and alfalfa-grass dry-hay mixtures in the U.S. also had a year-over-year jump to over 15.6 million acres. This was a 3.2% increase that comprised 481,000 additional acres.
The top three states for alfalfa dry-hay acres harvested in 2023 were South Dakota (1.69 million), Montana (1.65 million), and North Dakota (1.53 million).
The jump in harvested alfalfa dry-hay acres was the first upward movement since 2019 and was generally the result of more favorable growing conditions in the West and Great Plains.
North Dakota easily checked in with the greatest year-over-year gain in harvested alfalfa hay acres at 390,000. It was followed by Montana with 220,000 more harvested acres. Kansas had a 75,000-acre boost while Washington added 70,000 alfalfa acres compared to the previous year.
Wisconsin was tagged with highest year-over-year drop in dry alfalfa hay acres at 160,000. This is somewhat surprising given the dry conditions in the state and frequent long windows for getting hay baled, although most alfalfa in the state is typically chopped and ensiled. Both Illinois and Idaho dropped by 60,000 harvested alfalfa hay acres.
Seventeen states report forage production data with all harvest methods included (hay, haylage, and greenchop). When considering alfalfa acres harvested for all purposes, South Dakota held onto the top position with 1.75 million acres of alfalfa harvested. Wisconsin checked in with 1.31 million acres while Idaho maintained its third-place position with 1.06 million acres.
New alfalfa seedings
New seedings of alfalfa and alfalfa-grass mixtures in the U.S. during 2023 totaled 1.74 million acres, which was 68,000 acres more than 2022. Wisconsin easily had the highest number of new-seeding acres at 210,000 but was still down 50,000 acres from the previous year and 90,000 acres from 2021. Two other states had new seeding alfalfa acres totaling 100,000 or more in 2023: Idaho and Nebraska.
Hay yield
The average U.S. dry-hay yield (all types) declined from 2.29 tons per acre in 2022 to 2.25 tons per acre in 2023. For alfalfa and alfalfa-grass mixtures, the year-to-year average yield dropped minimally from 3.22 to 3.19 tons per acre.
Arizona and California continued to dominate the average alfalfa yield category in 2023, harvesting 8.3 and 6.5 tons per acre, respectively.
Looking at the 17 states that report all harvest methods, alfalfa yields on a dry equivalent basis averaged 3.56 tons per acre, down 0.04 tons from 2022. Among these 17 states, only South Dakota (2.39 tons per acre), Minnesota (2.64 tons per acre), and Missouri (2.24 tons per acre) had an average yield of under 3 tons of dry-equivalent forage.
Corn silage
Corn silage production in the U.S. rose slightly in 2023, following two years of declining acreage. The average yield jumped from 18.7 tons per acre in 2022 to 20.1 tons per acre in 2023; however, the acreage of corn silage declined in 2023 by 380,000 acres and totaled 6.47 million. Combined, these factors resulted in a final 2023 corn silage production total of nearly 130 million tons, which was 1.3% higher than the previous year.
As it always does, Wisconsin easily led the nation in corn silage production in 2023 with nearly 16.84 million tons produced from 780,000 acres; however, both acreage and average yield was down compared to the previous year. Once again, Idaho topped the yield chart in 2023 with an average mark of 28 tons per acre. Arizona followed closely behind at 27 tons per acre.
In summary . . .
In recent years, we’ve become accustomed to declining hay production metrics in the U.S. Although that trend may continue going forward, the past year at least temporarily reversed some of those declining numbers. In 2023, the nation’s total dry-hay production was up 6.2%. Year-over-year increases were also noted for alfalfa hay, grass hay, and new alfalfa seedings. All of this was reflected in greater December 1 hay stocks after several years of decline.
Overall, better growing conditions were experienced in 2023 compared to 2022, especially in the Western and Great Plains states. Unfortunately, the Midwest and some Eastern states won 2023’s drought lottery, and many of those states experienced significant production declines during the first half of the growing season.
U.S. dry-hay production hit its peak in 1999 when 159.6 million tons were put into barns. Since that time, a slow but steady production decline has taken place, despite higher yields. In addition to producing less dry hay, we are also utilizing smaller amounts through the winter months even though beef and dairy cattle numbers have remained relatively stable. The growing popularity of higher moisture hay harvest methods such as baleage might play a factor as well.
Hay markets (and weather!) are regional in scope. From these USDA reports, it’s easy to see that there was a wide state-level range of production gains and declines compared to the previous year. Extreme weather events are becoming more common, and virtually all of these are localized. There’s a reason why farmers talk a lot about the weather; it’s the tail that wags the hay-producing dog.
In addition to regional weather extremes, there are also localized market factors. For example, in the West, hay export prices and demand often help to dictate market prices. In other areas, strong equine markets do the same. Most states appear to have adequate supplies of hay this winter, although some regions are reporting dwindling supplies of high-quality inventories.
Overall, hay prices have come down considerably in the past year; however, the market has now seemed to stabilize. Expect the usual small uptick in hay prices as we move through winter but no major movement in prices through the year unless widespread drought defines the 2024 growing season.
If you’d like to look deeper into the 2023 hay production numbers for your specific state, access USDA’s Crop Production Annual Summary.