The advent of forage testing, especially since near-infrared spectroscopy (NIRS) came on the scene, has moved the needle by leaps and bounds from a harvest timing and animal performance standpoint. It also has offered us tremendous insights into how environmental conditions and plant maturity impact the quality of the forage we feed.
Looking back, our initial attempts to quantify forage quality were helpful and science based — but crude. We effectively got crude protein by measuring nitrogen, acid detergent fiber (ADF), and neutral detergent fiber (NDF).
Because ADF and NDF were a little hard to comprehend at the farm gate, researchers turned to single-term metrics such as total digestible nutrients (TDN) and relative feed value (RFV). The former is derived directly from ADF while the latter uses both ADF and NDF. Unfortunately, ADF-derived TDN and RFV still get widespread use, which is hard to understand in an agricultural world of advanced technologies. There are much better options for both.
The TDN problem lies with those equations that use acid detergent fiber (ADF) to calculate TDN. Dan Undersander, emeritus extension forage specialist with the University of Wisconsin, often notes that ADF was never meant to be used as a predicter of forage digestibility, and that ADF-derived TDN values fall short of assessing actual feeding value.
The alternative to an ADF-derived TDN is a summative equation approach, whereby TDN is calculated by adding together the digestibility of nonfiber carbohydrates (NFC), crude protein (CP), fat, and neutral detergent fiber (NDF). One only must look at the difference in approaches to determine which one offers the most accurate assessment.
This same thinking can also be applied when we think of the difference between RFV and relative forage quality (RFQ), with the latter being derived by a summation of terms, including TDN, and the former derived only from ADF and NDF.
Enough is enough
The RFQ metric for indexing forage nutritive value has now been around for nearly 20 years. Though widely used, it is still much too common to see its predecessor, RFV, being used. It’s one thing to see it on a farm’s forage test report, but I still see research scientists using it to report the quality of everything from cover crops to corn silage.
Over three decades ago, RFV totally shifted the focus of alfalfa evaluation from crude protein and into the realm of fiber analysis. Though not a measure used for balancing rations, it provided a single-term means of indexing forage for assessing alfalfa quality — and only alfalfa quality. The concept was widely adopted because it was easy and defendable with the day’s evaluative knowledge. From the start, it was only meant to be used for alfalfa, not grasses.
Using RFV on forage types other than alfalfa made them look much worse than they really were. Without delving into the equations, RFV failed to consider that not all fiber is created equal in terms of digestibility, which is a similar situation with ADF-derived TDN. That’s where RFQ has a huge advantage.
Grasses get their fair due
Like TDN, RFQ is not perfect, but it does offer a one-stop shop to initially evaluate the quality of a forage. Better yet, it gives grasses their fair due and considers the impacts that the growing environment (moisture and temperature) has on forage fiber digestibility.
It makes sense that RFV and RFQ are highly correlated; values for both generally decline as plant maturity advances. That said, they are not the same, especially for grasses and where environmental factors come into play.
During my extension career, I was involved in measuring the yield and forage quality of alfalfa fields that spanned across Wisconsin. For two of those years, 2010 and 2011, I decided to compare the RFV and RFQ values for each cutting from all the project fields.
Figure 1. RFV versus RFQ for Wisconsin first cutting in 2010
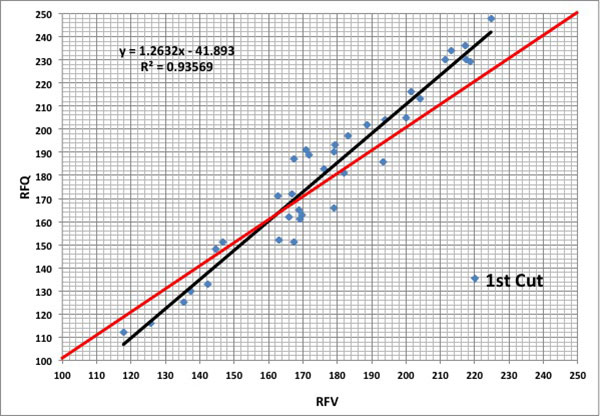
The red line in the graph depicts a one-to-one relationship. In other words, if RFV and RFQ were exactly equal, the data points would fall on the line. Rather, what I saw is that for higher quality samples (mostly those cut early), RFQ was greater than RFV (data points above the red line). This held true in both years.
In 2010, as maturity advanced and forage quality declined, RFV was often higher than RFQ (data points below the red line). RFQ penalized the forage for lower fiber digestibility; RFV did not. This is what I’ve found to be the normal trend for first and subsequent cuttings.
Growing conditions matter
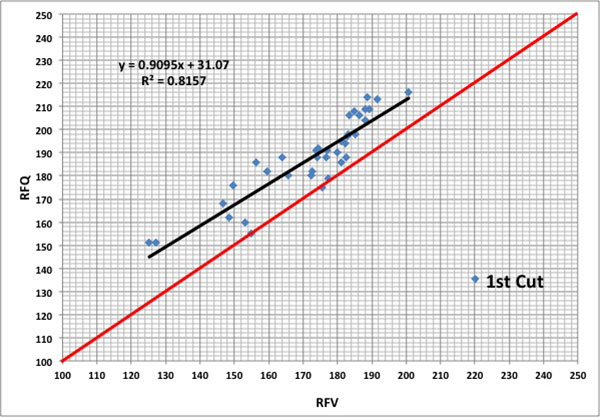
The next year (Figure 2) told a different story, primarily because temperatures stayed relatively cool throughout the earlier than normal harvest window and RFQ remained above RFV for the entire harvest window. The lesson is that 150 RFV forage may be 150 RFQ, or it may have a RFQ value significantly higher or lower than 150.
Figure 2. RFV versus RFQ for Wisconsin first cutting in 2011
Species, maturity, and growing environment (especially temperature) will dictate actual fiber digestibility. It’s more likely that RFQ will better reflect how the forage actually “feeds.”
The ramifications of the differences between RFV and RFQ are quite large for the buyer, seller, and feeder of forage. Even if cut at the same maturity, forage grown in a hot, arid environment is different than that grown in a higher elevation where night temperatures are cool. RFQ will discern this difference.
There was a day when I thought I’d eventually see the end of ADF-derived TDN and RFV. Now, after seven decades of life, I’m not so sure I will, and that is one of my greatest career disappointments.