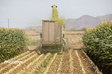
Digman (pictured) is an agricultural engineer at the University of Wisconsin-Madison. Jerry Cherney and Debbie Cherney are the extension forage agronomist and an animal science professor, respectively, at Cornell University.
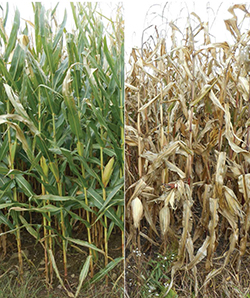
Research advocates for harvesting corn at a defined maturity and moisture content for optimal storage, utilization, and milk per acre. As corn plants mature, they increase in dry matter, and starch accumulates, displacing sugar, fiber, and ash. A study at the University of Illinois observed that corn silage harvested at 30% dry matter (DM) resulted in 7% to 25% less milk per acre when compared with silage harvested at an optimum DM content of about 35%.
Sampling plants generally involves a trip to the field, collecting and chopping whole plants, and then drying in a microwave, Koster tester, air fryer, food dehydrator, or forced-air oven. This limits how many samples can be managed and the time between collecting data.
While hand-held and on-harvester near-infrared reflectance spectrometers (NIRS) are effective, they haven’t been widely adopted and are expensive. There are positive independent research data backing NIRS offerings from multiple vendors (see our previous article, “In-hand forage quality,” in the April/May 2018 issue of Hay & Forage Grower). Additionally, moisture varies significantly, and the NIRS technique is strongly influenced by sample moisture content. In fact, samples are routinely dried to use NIRS to predict other chemical components such as protein, fiber, and starch.
NIRS goes mini
But what if there was a simple, low-cost device that you could put in your pocket and use to check corn plants? Does this sound like science fiction?
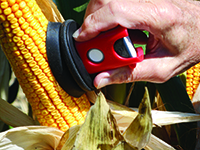
The SCiO device was developed by Consumer Physics (Tel-Aviv, Israel) and utilizes a patented technology to glean a spectrum from 740 to 1,070 nanometers (nm). These instruments work on the principle of illuminating the sample and measuring light absorbance. But how do you measure the light that’s not there?
We measure the light that’s not absorbed (reflected) and assume that the missing light was absorbed. The light absorbed by the sample is related to several physical characteristics and chemical species, but here we are counting on that some is due to the water content. The numbers 740 to 1,070 are the wavelengths of light the instrument is sensitive to. In the visible spectrum, violet light is about 400 nm, and red is about 700 nm. Note that the device operates outside of the red, in the infrared.
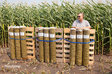
To evaluate the SCiO device and the accompanying calibration, we scanned over 700 ears of corn throughout New York state. We collected the entire plant to determine whole-plant moisture by drying in a forced-air oven.
Still not there
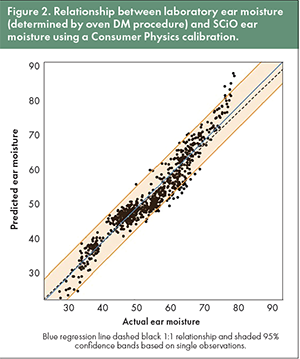
So, did it work?
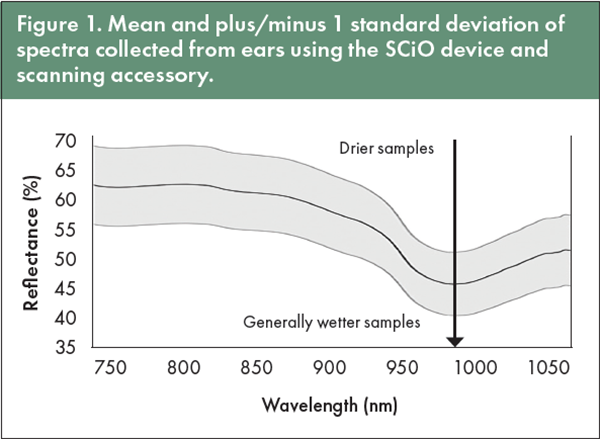
Look at the data collected with the SCiO, which is presented in Figure 1. Note the wavelength range at the bottom of the chart. Also, note there is a depression around 970 nm. This is a known absorbance peak for water. It looks like there is promise for this approach.
We have one season of such data under our belt, and the results look promising. In the meantime, I would suggest looking at one of the hand-held NIRS devices described in our previous article or investing in a Koster tester. While you will still need to collect and chop the whole plant, you will have a reliable indication of when to harvest.
This article appeared in the Aug/Sept 2021 issue of Hay & Forage Grower on pages 16 and 17.
Not a subscriber? Click to get the print magazine.