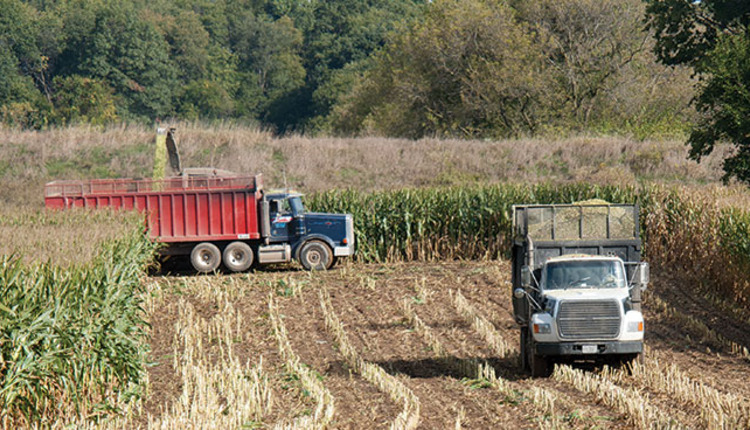
It is well known that reducing the size of corn kernels in whole plant corn silage makes it more digestible for the cows and enhances milk production. How much to process those kernels is another question.
Reducing the gap between the kernel processing rolls lowers the mean particle size of the corn kernels, but there is a cost in that more machine power is required to process the corn silage; this translates to higher fuel consumption and reduced harvest speed. Finding the optimal kernel processing roll gap would be ideal, allowing for the maintenance of feed quality and harvest efficiency.
What is sufficient kernel processing in chopped and processed corn silage?
Mertens (2005) developed the corn silage processing score (CSPS), also known as the kernel processing score (KPS). This method requires sieving the whole plant corn silage in a rotary shaker table. The material passing through a sieve with an opening size of 4.75 millimeters (0.187 inch) is analyzed for starch content, and the amount of total starch passing through that sieve is the KPS.
KPS quick tests
Kernel processing is considered excellent if more than 70 percent of the total starch passes through the 4.75 mm sieve; 50 to 69 percent passing through the sieve is deemed as adequate. This analysis is typically done in a lab where samples are sent in for analysis. While there is no replacement for lab analysis of your harvested corn silage, these results returning to the producer post-harvest does not provide any opportunity to adjust the machine for optimal harvest efficiency and feed quality.
Currently, visual assessment of the corn kernels is the only way to quantify particle size distribution in the field during harvest. A common method of doing this is taking a 1-quart sample of the chopped and processed corn silage and visually searching for whole kernels. If one or more whole kernels is found within a quart of corn silage, then the kernel processor rolls need to be moved closer together.
Another method is hydrodynamic separation of the kernels from the plant material. When a sample of whole plant corn silage is submerged in a pan or bucket of water, the plant material floats on top while the kernels sink to the bottom. The plant material can be skimmed off leaving the kernels for visual assessment. Both of these methods are subjective and do not provide any measurement of the kernels to ensure sufficient processing.
A new approach
At the University of Wisconsin-Madison, we have been working to develop a smartphone application that will provide information about the particle size distribution of the corn kernels while in the field during harvest. Image analysis has the capability of determining the size of each pixel in an image if a reference object is included. Use of the application requires separating the corn kernels from the plant material. The simplest method for achieving this is by hydrodynamic separation. The University of Wisconsin-Extension has a nice article on this method titled “Making sure your kernel processor is doing its job” (Shinners and Holmes, 2013).
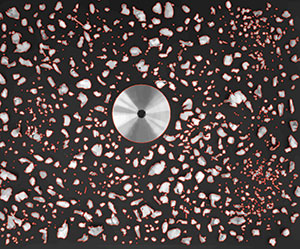
Once the kernels have been separated from the plant material, they are spread on a dark background. Next, a U.S. coin (penny, nickel, dime, or quarter) is placed in the center of the sample and a picture is taken of the sample. The analysis of the developed image identifies the kernel pieces in the image (see picture), counts the kernel pieces, measures their size, and provides a report to the user. The sufficiency threshold used for proper kernel processing is if more than 70 percent of the kernel pieces in the image are smaller than 4.75 mm.
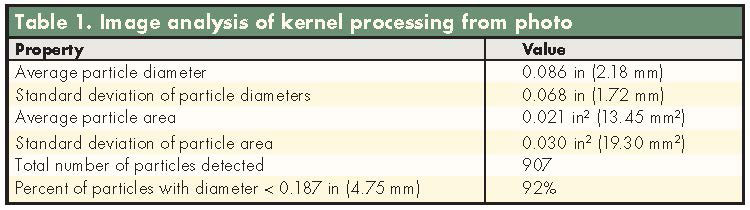
The results in Table 1 indicate that the average particle diameter is 0.086 inch, which is well below the threshold of 0.187 inch. Ninety-two percent of the particles detected in the image are smaller than 4.75 mm (0.187 inch). This is an indication of sufficient kernel processing; however, something to consider is how many small particles are in the image. If there are many more small particles than large particles, the results of the image analysis can be skewed. To ensure accurate results, take multiple images of several samples (at least three). Average the three resulting average particle diameters to get a better representation of the actual mean particle diameter of the processed corn silage.
This corn kernel particle size analysis tool will be a fast and efficient way for producers, nutritionists, and custom harvesters to verify the performance of kernel processing rollers on forage harvesters. This quick in-field verification will allow for the maintenance of high-quality feed production and also allow for more closely optimal harvest speed and fuel efficiency. Watch for the release of this smartphone application
in mid-2017.
This article appeared in the March 2017 issue of Hay & Forage Grower on pages 26 and 27.
Not a subscriber? Click to get the print magazine.

