Whether you are in the business of growing and selling forages or feeding cattle, correctly assigning the economic value of forages can impact profitability. Forages obtain their economic value when fed to animals, and a forage appraisal system should reflect the ability of that forage to support growth and milk production.
That ability is a function of the nutrient composition of the forage and its effect on feed intake. Relative feed value (RFV) and relative forage quality (RFQ) are often used to appraise forages; however, they put no value on protein, they consider fiber only as a negative factor (higher fiber equals lower RFV and RFQ), and they are not good when comparing across forage classes (for example, alfalfa, grasses, or corn silage).
Forage nutrients
The major nutrients needed by cattle are energy, protein, and fiber. Because dairy is a major user of forages and essentially all labs provide net energy for lactation (NEL) values, NEL will be the basis of this article. The NEL concentration depends mostly on fiber (higher equals lower NEL), fiber digestibility (higher equals higher NEL), and ash (higher equals lower NEL).
Lab results usually include crude protein (CP); however, not all CP is created equal. Most ruminant nutritionists balance diets for metabolizable protein (MP) rather than CP. The concentration of MP depends on the digestibility of the rumen undegradable (or bypass) protein and on the proportion of rumen degradable and undegradable protein in a feed.
The problem with using MP is that it is calculated for diets and not individual feeds. Labs usually do not provide an MP concentration. However, if we assume that the forage will be fed in a balanced diet and has typical rumen degradability, then its MP equals CP times 0.56. If alfalfa hay had 22% CP, it will have approximately 12.3% MP. The CP in other common feed ingredients have different conversion factors to MP. Because feed evaluation software uses several different feeds, MP, rather than CP, must be used.
Most dairy nutritionists use neutral detergent fiber (NDF) in ration formulation. The NDF from all feeds provide energy, but NDF from forages is needed for rumen health, which translates into better animal health and improved milkfat production. For this reason, NDF from forages is worth more than NDF from other feeds such as distillers grains. By dividing NDF into two fractions, effective and non-effective NDF (eNDF and neNDF), we can give more value to the NDF that promotes rumen health. The NDF from forage can be considered 100% eNDF.
What are nutrients worth?
Routine lab analyses provide nutrient composition data, but we need to translate those numbers into dollar values. Software programs are available to compare feed prices based on nutrient composition. Sesame, which was developed at The Ohio State University, estimates the dollar value of nutrients (Table 1) using a statistical method that relates prices of a host of different feeds to their nutrient concentrations. These values are also available from various sources such as Buckeye Dairy News (dairy.osu.edu).

The Sesame software is available free of charge at dairy.osu.edu/node/23 (user name = sesame; password = open).
The calculated prices are specific to a given market and may not reflect historical or future prices. Note that estimates for nutrients are not absolute and include a plus/minus term (Table 1). The plus/minus terms mean that those four nutrients alone are not the only factors affecting feed prices. The uncertainties associated with nutrient prices need to be reflected in the calculated total value of feeds.
As an example, let’s say we have a truckload of alfalfa hay sold in the Midwest that is 85% dry matter (DM). Its nutrient composition on a DM basis is 0.62 Mcal of NEL per pound, 40% NDF, and 23% CP. Because alfalfa is a forage, eNDF equals 40% and neNDF equals zero. First, we convert CP to MP by multiplying by 0.56 so that MP equals 12.9%. Second, we calculate how many nutrients are in a ton of hay.
One ton of this hay has 1,700 pounds of DM (2,000 times 0.85).
That DM contains 1,054 Mcal of NEL (1,700 times 0.62), 219 pounds of MP (1,700 times 0.129), and 680 pounds of eNDF (1,700 times 0.4). Next, we put a value on those nutrients using Table 1.
The 1,054 Mcal of NEL has a value of $63 (1,054 times 0.06), MP is worth $81, and the eNDF is worth $61. Summing those values equals $205 per ton (63 plus 81 plus 61). Because all feed prices were put into the program on an as-delivered basis, that is the average delivered value of the hay. However, when it comes to valuing forages, it is not that simple.
Consider intake, too
Nutrient intake by cows profoundly influences productivity, and forage quality has a major effect on intake. Unfortunately, the nutrients discussed above do not adequately account for differences in potential intakes among forages. For forages, the best single lab assay to estimate differences in intake is in vitro NDF digestibility (IVNDFD).
Within a forage class (for example, legume or corn silage), a 1% unit increase in IVNDFD on average boosts intake by 0.26 pounds per day and milk yield by 0.47 pounds per day. This is based on Michigan State University research from Masahito Oba and Michael Allen, which was published in the Journal of Dairy Science in 1999.
Those values are only appropriate for a change in IVNDFD. For example, if a forage with 50% IVNDFD was replaced with a forage with 55% IVNDFD (within the same forage class), milk would be expected to improve by 2.4 pounds per day (5 times 0.47). The same response would be expected if IVNDFD increased from 35% to 40%.
Since intake and milk are associated with change in IVNDFD, a base IVNDFD value is needed. The base values used here are the mean IVNDFD for alfalfa, grass, and corn silage from a publicly available feed library; in this case, it comes from DairyOne Laboratory, Ithaca, N.Y. It does not matter if you use a 30- or 48- hour incubation, but the incubation time must be consistent within a comparison.
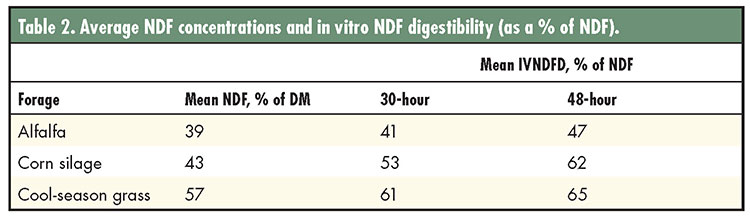
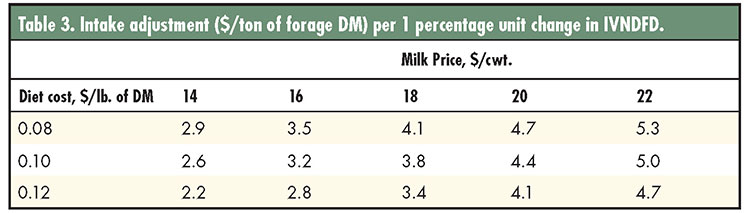
To calculate the quality adjustment, the difference between IVNDFD of the forage sample and base value (Table 2) is calculated: IVNDFD (sample) minus IVNDFD (base). The value is then multiplied by 0.26 to estimate change in intake and 0.47 to estimate change in milk yield. The dollar value of “forage quality” depends on the milk price and diet cost (Table 3).
Ration cost can vary
The cost of diet varies depending on the production level of the herd and the ingredient costs, but in most cases, it will range between 8 to 12 cents per pound of DM. If available, actual farm-derived feed costs should be used, but if not, we suggest using 10 cents per pound. If the corn price is more than 10% or 20% above the historical price, use 12 cents, and if corn grain is 10% or 20% less than historical average, use 8 cents per pound. The studies summarized by Oba and Allen had an average forage inclusion rate of 31 pounds, so that value was used in our calculations (Table 3).
As an example, let’s assume alfalfa hay has a 48- hour IVNDFD of 54%. We will also assume a milk price of 19 cents per pound and a diet cost of 8 cents per pound of dry matter.
1. Difference in IVNDFD from standard: 54 – 47 = 7 units
2. Expected increase in milk yield: 7 x 0.47 = 3.3 pounds per day
3. Expected increase in DM intake: 7 x 0.26 = 1.8 pounds
4. Expected gain in income over feed cost: (3.3 x $0.19) – (1.8 x $0.08) = $0.49
5. Converting to a ton basis: 0.49/31 = $0.016 per pound = $32 per ton of DM or about $27 per ton of hay at 85% DM.
That value is added (or subtracted) from the nutrient value calculated as described above. Therefore, alfalfa hay in our example has a total value of $232 per ton ($205 plus $27).
To simplify these calculations, Table 3 has quality adjustments for various diet costs and milk prices. A user selects the most applicable diet and milk prices, finds the quality adjustment, and adds (or subtracts) it from the nutrient value. If a forage had 3 percentage units less IVNDFD than the base, the milk price was $20 per cwt., and the diet costs 10 cents per pound of DM, the quality adjustment would be 4.4 x (-3) = $(-13.2) multiplied by the DM percent as a decimal, or about $11 per ton on an as-fed basis if the hay was 85% DM.
The value calculated using this method has uncertainty associated with it, and the nutrient value should actually be considered as a range. A good benchmark for this range is plus or minus 12.5% of the calculated value.
In the example above for $232 per ton alfalfa, a reasonable range is $203 to $261 per ton. Prices at the low end of the range would be considered a bargain for the buyer, and prices at the high end would be overpriced. Prices near the calculated value of $232 per ton would be considered the break-even price. Using this method gives growers an idea of what improved nutrient quality is worth, offering buyers the ability to make more informed purchasing decisions.
This article appeared in the February 2020 issue of Hay & Forage Grower on page 31.
Not a subscriber? Click to get the print magazine.