Managing a grazing system without measuring forage production or animal performance is like setting the lineup for a fantasy football team without knowing the players’ statistics. In either case, the outcome will be hard to predict, and oftentimes less than ideal.
The end of the grazing season is an opportune time to reflect on pasture management over the past few months and assess grazing data. Evaluate previous forage yield, quality, and pasture composition, as well as animal weights, average daily gain, and stocking rates. If such information doesn’t exist, it may be a good time to set goals and determine how to collect grazing data next year.
“It is often said you cannot manage something that has not been measured,” says Sandy Smart with South Dakota State University Extension. “The same can be applied to range management.”
Smart, an agriculture and natural resources senior program leader, explains the climatic, topographic, edaphic (soil), and biotic factors of a grazing system influence nutrient cycling and energy flow in a pasture. Producers must measure these factors and understand how they impact forage production to effectively manage those processes.
“Indicators of these four key areas can be monitored and plotted over time to help the manager identify strategies to bring the pasture environment back into optimal ecosystem function,” Smart states.
Tools and tactics
Resources such as the Web Soil Survey and Google Earth may be useful in understanding the topography and soil properties of a pasture. Smart suggests using rain gauges to track monthly precipitation patterns and create a rolling 12-month average for the farm. Moreover, keeping grazing records will provide documentation of grazing periods and rest periods throughout the year, as well as how environmental and/or management factors affect pasture composition.
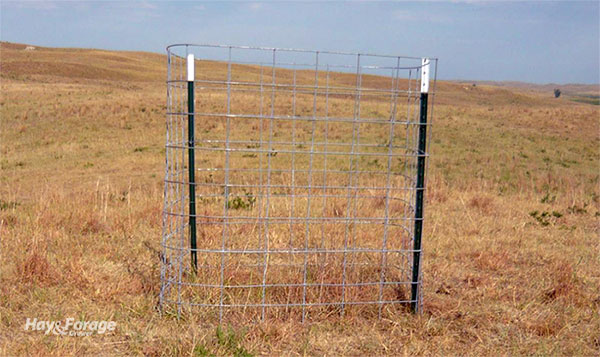
Smart also points to grazing cages as other tools to monitor forage yields on a specific site during the grazing season. A grazing cage can be made by wrapping a 16-foot cattle panel around two T-posts.

“If you clip the vegetation inside the enclosure using a grazing hoop, dry it, and weigh it, you can get an accurate measurement of total season forage production,” Smart adds. “Tying those measurements to monthly rainfall data allows you to make site-specific predictions for your ranch, which you can use to develop your drought plan.”
Creating a permanent recovery pen is an option to observe how climatic, topographic, edaphic, and biotic factors affect long-term forage production. Smart describes a recovery pen as an area that is omitted from the grazing system for a few years and used as a control site to see how species composition changes in the grazed acres over time. He also recommends periodically recording notes and taking pictures of pastures.
Map out forage utilization
In addition to monitoring forage growth, grazing cages can also provide information about grazing activity across a pasture. Comparing plant height and density inside the cage to that outside the cage will reveal how forage is utilized by livestock, and mapping this data can help guide future grazing decisions.
Smart referred to a real-life example of this that Jim Gerrish shared at a previous South Dakota Grassland Coalition Winter Road Show. Gerrish mapped the forage utilization of a 2,640-acre winter pasture that cattle continuously grazed with access to only a single water source. As predicted, the animals overgrazed forage near the water source and underutilized forage in other parts of the pasture. The stocking rate was approximately 7.2 animal unit days per acre.
The following year, Gerrish installed a stock water system with eight water tanks around the winter pasture. This improved the stocking rate to about 13.6 animal unit days per acre as forage utilization became more balanced.
In the third year of the experiment, Gerrish achieved a stocking rate of nearly 29 animal unit days per acre by dividing the field into 16, 160-acre paddocks and encouraging uniform forage utilization via rotational grazing.
“Jim provided the economic analysis and showed that the cross-fencing alone provided an additional $36,000 in feed savings, which paid for the cross-fencing cost in one year,” Smart adds.
Another example from Kansas State University also boasts the benefits of mapping forage utilization by comparing intensive-early stocking and season-long grazing. “Intensive-early stocking is a practice where you double stock the rangeland, but only graze half the season,” Smart explains.
“The point is that this grazing method is like splitting your pasture in half and grazing it during the first part of the season and resting it the second half,” Smart continues. “In doing so, the stocking density increases, and you get better grazing distribution.”
The results of the study show intensive-early stocking supported about 34% more beef per acre at the same stocking rate as season-long grazing. Forage utilization was also more even across the pasture in the former system compared to the latter.
In both situations, the more effective approach to grazing cattle was anchored in and supported by grazing data. Taking measurements and monitoring pastures can reveal areas of improvement in a grazing system that could boost forage production and enhance livestock performance.

