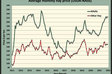
The annual release of hay and forage data by USDA that defines the previous year’s hay production and year-ending inventories last month. The Crop Production and Crop Production Annual Summary reports offer a glimpse of the current state of the forage industry and provide a gauge to measure hay market sensitivity to various production pressures in 2022.
Overall, virtually all forage production metrics were down in 2021 compared to the previous year — even corn silage production.
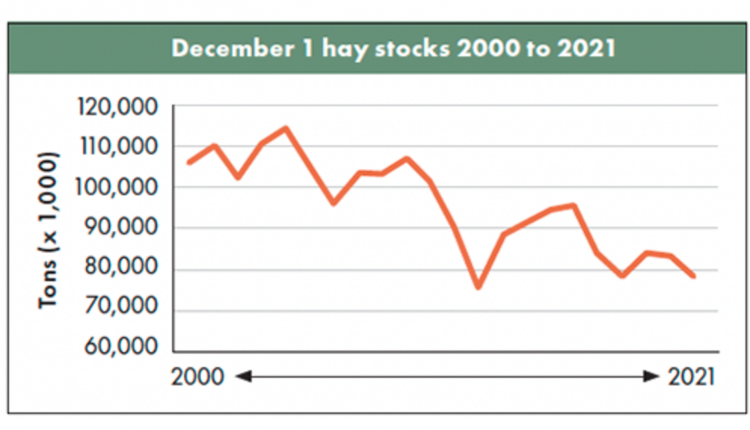
The USDA makes its assessment of dry hay stocks in May and December of each year. Last May, spring hay stocks declined by a little over 2.4 million tons compared to the previous year.
USDA pegged December 1, 2021, hay stocks at about 79 million tons, down 5 million tons or 6% from the previous year. This puts stocks at essentially the same place they were in December 2018. Of course, they are far below the levels seen during the first 10 years of the decade.
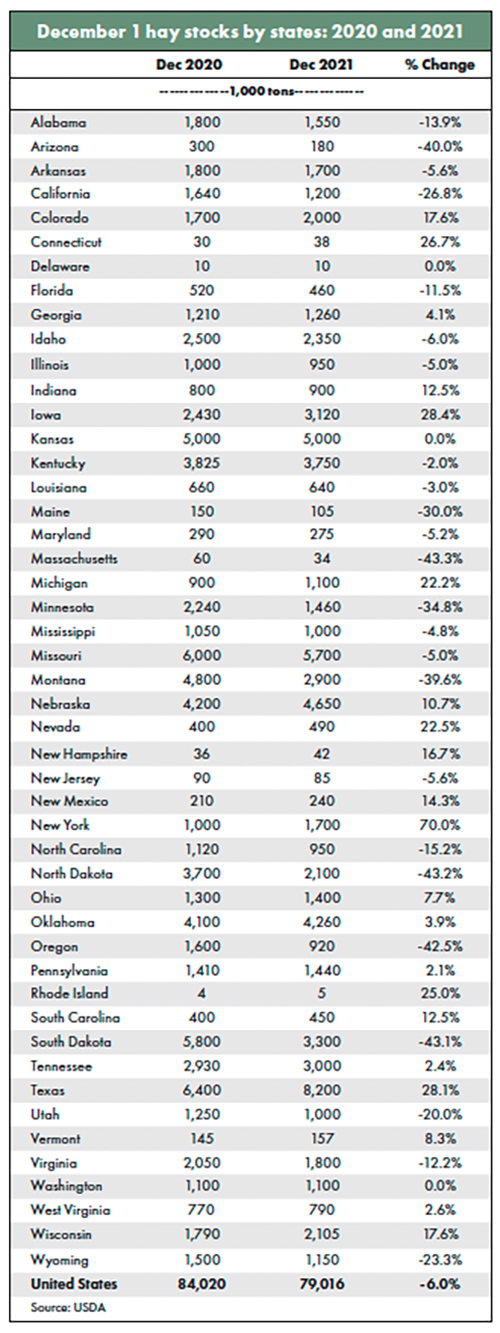
As might be expected, individual states varied in the total amount and direction of hay inventory change (see table below). Of the major hay-producing states, the largest inventory reductions occurred in those that have been hit hard by drought:
North Dakota – down 43.3%
South Dakota – down 43.1%
Oregon – down 42.5%
Arizona – down 40%
Montana – down 39.6%
Minnesota – down 34.8%
Some states had significant inventory gains. These included:
New York – up 70%
Iowa – up 28.4%
Texas – up 28.1%
Nevada – up 22.5%
Michigan – up 22.2%
Bottom line: The lower December hay stocks come as no surprise; it was just a matter of to what degree. Overall, the level of U.S. December 1 hay stocks has dropped over 15 million tons since 2016. At the same time, the U.S. has also experienced a significant decline in the amount of dry hay disappearance between December and the following May. Currently, both dairy and beef cow numbers are in decline.
This article appeared in the February 2022 issue of Hay & Forage Grower on page 25.
Not a subscriber? Click to get the print magazine.