The author is an extension forage specialist with West Virginia University.
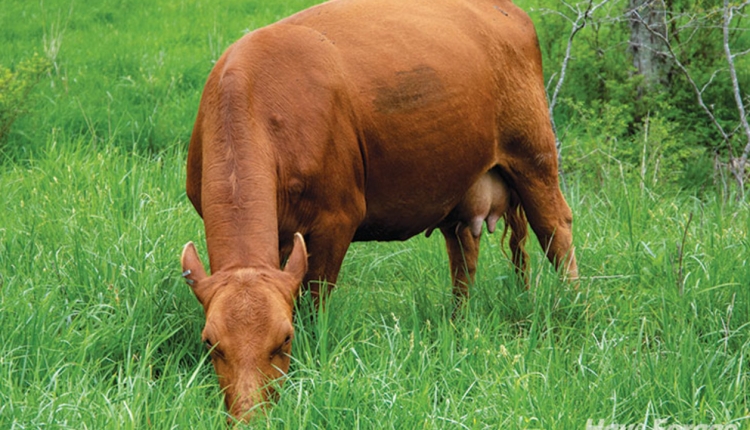
Pastures are often the least-cost option for ruminant livestock production. In much of the Northeast, pasture and aftermath-grazed hay meadows are the largest portion of the agricultural acreage. University research provides guidelines on how to best manage pastures. However, how well livestock on farms utilize pasture is not often measured. The following is a summary of on-farm pasture research that provides a view of how well pastures are utilized when livestock graze in rotationally stocked pastures.
Rotationally stocked pastures on farms in West Virginia and southwestern New York were sampled before and after grazing. Each of the seven farms had four to eight paddocks, which were sampled two or three times between May and November and over two to three years. Farm locations ranged from 39 to 42 degrees North latitude, at elevations from 1,000 to 2,600 feet above sea level.
Depending on the farm, pastures were grazed by beef cow-calf pairs, yearling steers or heifers, or lactating dairy cattle. Grasses in the pastures varied across farms and included orchardgrass, tall fescue, timothy, smooth bromegrass, bluegrass, bentgrass, and quackgrass. The legumes in the pastures included white clover, red clover, birdsfoot trefoil, and alfalfa.
In each pasture, 15 random forage samples were taken before and after grazing. Forage samples were clipped at ground level to recover as much of the live and dead material as possible.
Forage mass was measured as pounds of dry matter (DM) per acre per grazing event. Pregrazing initial forage mass and postgrazing residual forage mass samples were analyzed for crude protein (CP), neutral detergent fiber (NDF), and total digestible nutrients (TDN) as a percentage of DM. The forage mass grazed off by livestock was calculated as the difference between the initial and residual forage mass for the grazing event.
Each data point on the graphs represents a pasture sampled during one grazing event. A total of 80 grazing events provided data on utilization of the initial forage mass and 66 grazing events provided data on the utilization of forage nutritional components. The variability in sampling pastures is high due to plant species diversity and livestock management. Because of this, 5% of the pastures were extremely far from the regression average (greater than 2 standard deviations) and were considered outliers and removed.
Pasture utilization
The forage amount removed by grazing cattle was directly related to initial forage mass (Figure 1). Above a base forage mass of 700 pounds of DM per acre, 54% of the forage was removed by the grazing livestock. This is in line with the old saying of “take half and leave half.” The 700 pounds of DM per acre is significant in that it represents a residual height of 2 inches in an average pasture. This residual forage is tough, resistant to grazing, and also contains much of the carbohydrate reserves in grasses such as orchardgrass.
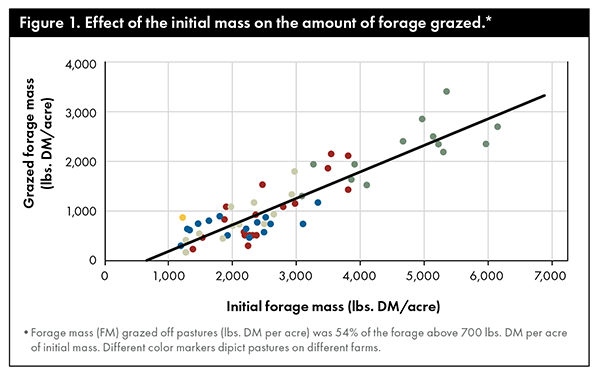
After accounting for the initial forage mass, grazed forage did not differ between farms. Two thirds of the samples ranged within 311 pounds DM per acre of the grazed forage trendline (Figure 1). In these on-farm projects, we had defined pregrazing and postgrazing heights. However, due to the relationship between livestock, forage, and human managers, there was a consistent pattern in grazed forage across pastures differing in plant species.
Pasture nutritive value
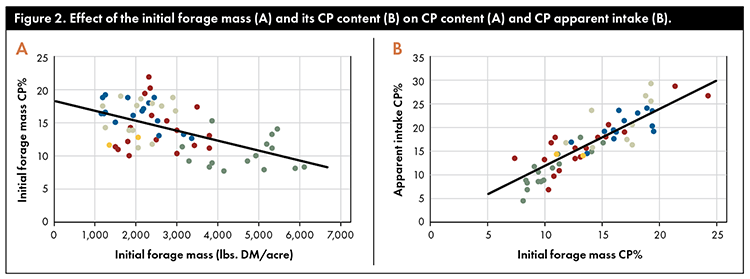
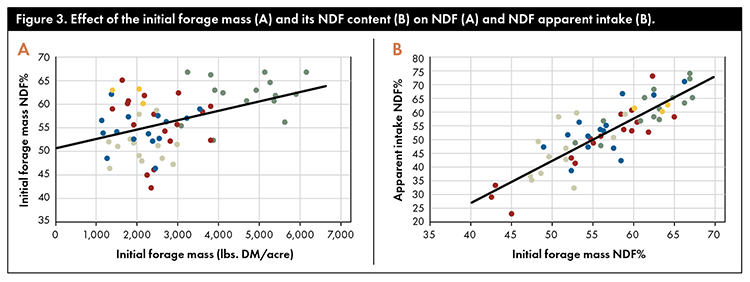
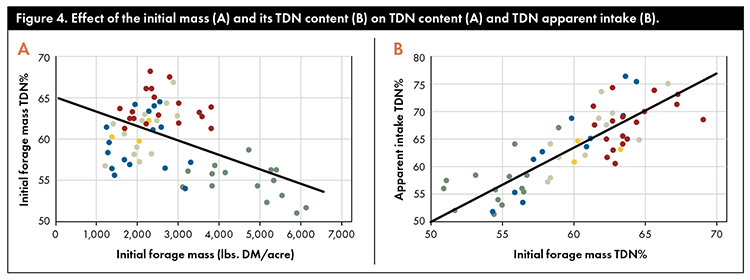
As pasture initial forage mass increased, the CP content of the initial forage mass dropped (Figure 2A), NDF content rose (Figure 3A), and TDN content declined (Figure 4A). After accounting for initial forage mass, there were no differences between farms in these nutritive value measurements.
The apparent intake of CP, NDF, and TDN in the forage mass grazed off the pastures increased as these nutritive components elevated in the initial forage mass (Figures 2B, 3B, and 4B, respectively). These relationships accounted for 73% to 80% of the variability in apparent intake.
Selective grazing is the ability of livestock to consume forage of a higher quality than the average quality in the pasture. Selective grazing for CP was uniformly positive across pastures at 20% above (1.2 times) the CP content in the initial forage mass (Figure 2B). For example, when the initial forage mass contained 20% CP, apparent intake CP averaged 24%.
Selective grazing for NDF was not uniform (Figure 3B). Low-quality pastures, having a high NDF content in the initial forage mass, provided little selective grazing. When the initial forage mass contained 65% NDF, on average, there was no selection and average NDF intake was 65%. On high-quality pastures having only 45% NDF in the initial forage mass, livestock selectively grazed and average NDF intake was 35%, 10 percentage units lower (Figure 3B).
Since TDN is a function of NDF, selective grazing for TDN was also not uniform (Figure 4B). On pastures having 50% TDN in the initial forage mass, average TDN intake was 50%. On high-quality pastures having 65% TDN in the initial forage mass, average TDN intake was 70%.
Pasture utilization ranged from 11% to 80% of the initial forage mass. Across this range, percent utilization had little effect on selective grazing, impacting only CP intake. When the percent utilization was included in the CP of the initial forage mass versus CP apparent intake relation, the average absolute error improved by only 1 percentage unit, so percent utilization was not included in the analysis.
Pasture quality matters
Across farms, pastures differed in their initial forage mass; residual forage mass; grazed forage mass; the percentage of CP, NDF, and TDN in the initial forage mass; and the percentage of CP, NDF, and TDN in the grazed forage. Pasture forage height was not descriptive of the CP, NDF, or TDN content in the initial forage mass. However, initial forage mass did a good job of describing trends in CP, NDF, and TDN content in the forage. As initial forage mass increased, the NDF content also rose while CP and TDN content declined.
After accounting for differences in initial forage mass, there were no differences between farms in the amount of forage grazed off the pastures. The apparent intake of CP, NDF, and TDN were highly and positively related to the content of the respective component in the initial forage mass. After accounting for CP, NDF, or TDN in the initial forage mass, the apparent intake of these components followed the same pattern across all the farms.
Livestock displayed selective grazing across pastures, with selection occurring primarily on high-quality pastures. This demonstrates that managing for high pasture quality is needed for optimum animal performance. Animals not needing high-quality forage will do well on lower quality pasture that does not allow for selective grazing.
The CP and NDF content in a pasture’s initial forage mass is dependent on legume content (legumes are higher in CP and lower in NDF than grasses) and maturity of the forage (younger forage is higher in CP and lower in NDF than older forage).
In spring, when plants are growing rapidly, regrowth intervals between grazing events of three weeks provide good forage growth and high forage quality. In midsummer, when cool-season forages have slower growth rates, regrowth intervals of five to six weeks provide adequate regrowth of high-quality forage.
When summer regrowth intervals exceed six weeks, forage quality drops as leaves age and die. After accounting for initial forage mass and its quality, utilization of the forage and apparent intake of CP, NDF, and TDN was uniform across farms and the forage species being utilized.
This article appeared in the January 2023 issue of Hay & Forage Grower on pages 26-28.
Not a subscriber? Click to get the print magazine.

