Over the years, many nutritionists and forage experts have advocated for the testing of feeds by a commercial laboratory and the use of that data as a basis for ration balancing to meet the nutritional needs of animals. We have watched as commercial producers have adopted these recommendations and now see very few producers who have not sampled and tested at least once and usually multiple times each year.
We are firm believers that this is the correct procedure for maximizing the use of available feeds, as well as maximizing the productivity and health of those animals in their care. However, the numbers that come out of that ration balancing program are only as good as those that are entered. Because of that, it is not uncommon for the livestock ration to not perform as expected. Many nutritionists put in “fudge” factors based on their experience or how the animals are actually performing.
Good samples needed
Ration balancing programs use the most current technologies available, so why are there so many discrepancies?
The most obvious variable is whether or not the collected sample submitted to the laboratory typifies the feed in question. The very nature of the process is that you will analyze a sample that represents the average. The problem is that this is harder than it may appear. Not all feeds within or between a field, a crop, and a year are the same. They may be close, but there is inherent variation around that “representative” sample.
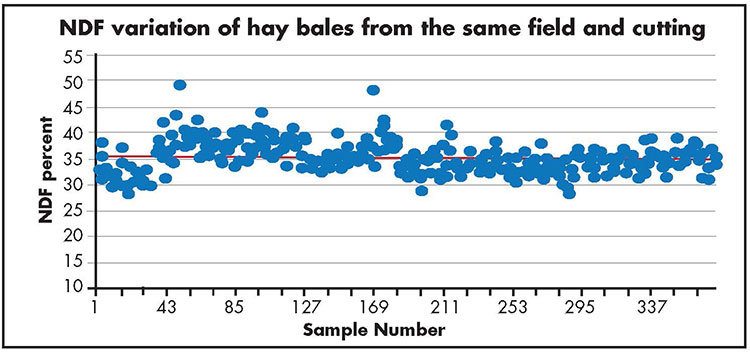
An example of that from one of our Utah State fields is shown in the graph. As you can see in this example, even if the sample is truly representative with an average neutral detergent fiber (NDF) percent, there is still a lot of variation between bales. You may not see it as you prepare the ration, but the cows can tell and this could account for daily variations in performance.
One suggestion is to group bales of similar composition so that you can reduce the daily bale-to-bale variation. That technology is now starting to come onto the market with “on-the-go” forage analysis. Another suggestion, and it’s a good idea anyway, is to sample more often. The big problem for some large operations is that they feed at such a high rate that they may be past that forage before the lab results are available. In this case, someone needs to be thinking ahead on what will be fed in the future.
Once the sample is taken, it needs to be analyzed. There is a widely held perception in the industry that there is great variability between feed laboratories. There are a lot of popular press articles, but surprisingly very few are based on research. Because of the number of large animal operations in the West, and also the large number of export operations for alfalfa, we were interested in determining how much variation there was within and between feed laboratories and forage types.

Put to the test
Twelve laboratories were selected for a blind test to analyze three hay types: mixed grass, prebloom alfalfa, and prebud alfalfa. Samples from a single source of each forage type were sent in duplicate, three times, and one month apart.
The samples were analyzed for dry matter (DM), crude protein (CP), NDF, acid detergent fiber (ADF), and other measures. We were primarily interested in the variation between samples, but we also looked at mean deviations from what we called our “reference” lab. The deviation from the mean, range between high and low results, and standard deviation for only the prebloom alfalfa hay is shown in the table.
On average, the deviation of the laboratory DM percent from the reference mean was pretty close. The interesting thing is that most of the numbers are negative (wetter than the reference). Before laboratory submissions, DM percent was determined for all samples by drying for 72 hours at 131°F. Out of all the submissions (n = 216), 49 percent produced negative differences when subtracted from our DM, indicating that samples gained moisture after mailing. Labs in areas with higher humidity than our area took on more moisture; this could affect ration balancing.
Our interest was in the range between the maximum and minimum value reported by an individual lab. Results ranged from 2 to 5 percentage units. For example, a lab with a 5 percentage unit range might span from 90 to 95 percent DM. The higher quality alfalfa had an average mean deviation of -3.0; the highest deviation was -6.8.
Surprisingly, one lab did not provide a DM percent as part of the analysis. Other than absorbing water, we don’t know why there should be more than a 2 percentage unit difference. All the samples should have been the same.
The table also shows variability in NDF percent because it is the basis for many calculations in ration balancing programs. The average range between the maximum and minimum value, across all labs, for the three hay types, ranged from 3.9 to 5.2; the highest range from the table is 12.2.
For our example hay, the average NDF percent mean was 41.7 percent. If you assume equal distribution, the lab results for the same sample could have read from 35.6 to 47.8 percent. This magnitude of range creates serious problems when balancing rations or selling hay. Acid detergent fiber percent also showed variability but not to the extent that NDF percent varied.
Out with RFV
This leads to one of the issues we saw that can affect the export business and many buyers or sellers of hay — relative feed value (RFV). We saw huge deviations, across all labs, in the reported value for RFV (data not shown). This is a calculation based on ADF and NDF.
The primary influencer of RFV variability was NDF percent, being much more variable than ADF. The prebloom alfalfa had a standard deviation of 9.2 points and an average range from maximum to minimum of 75 points; the prebud alfalfa range averaged 132 points. Ten of the 13 labs had a range of 20 or more points within the same hay type; USDA hay quality grades span 20 points. It’s no wonder there are fights over analysis.
We did almost everything we could to send the same sample to all labs every time. So, do we think labs are doing a bad job?
No, in general they are trying hard to give the best analysis possible. We saw many labs that were fairly consistent. In a related paper, we reported that the trend is toward using NIR more than wet chemical analysis. Turnaround time was ranked higher than accuracy and cost (both equal) in why producers chose NIR.
Don’t stop testing
We think that because of the volume of samples that go through many labs, coupled with the desire to have low turnaround times, errors may creep in that might not typically occur. This may be especially true on days with an unusual amount of samples. Our suggestion is to send duplicate, separate samples and average the two values, especially for samples that may have a high impact in a feed ration.
Our data surprised us when we looked at the RFV. We would not want to make a business decision based on what we saw. In fact, in our survey, 50 percent of the respondents reported losing money because of a business deal involving the analysis from a laboratory. Seven out of the 55 who responded to this question stated they had lost hundreds of thousands of dollars.
While this may be extreme, we think it’s time to consider doing away with RFV and develop a pricing system based on NDF percent, use RFQ as the standard, or develop something different where small changes in analysis don’t result in large derived end values. The additive impact of two analyses that may both be off a little can have too large of an effect on this value.
In summary, there can be variations between the “real” forage analysis results and the laboratory result. Sampling more often, sorting hay of similar composition, and sending duplicate samples to a laboratory can help reduce the variability of analysis and improve the accuracy of forage analysis. At the end of the day, we still recommend testing.
This article appeared in the November 2017 issue of Hay & Forage Grower on page 10 and 11.
Not a subscriber? Click to get the print magazine.