The annual release of hay and forage data that defines the previous year’s hay production and year-ending inventories arrived in email inboxes last week. The USDA’s Crop Production and Crop Production Annual Summary reports offer a glimpse of the current state of the forage industry and provide a gauge to measure hay market sensitivity to various production pressures in 2021.
Overall, it was difficult to find any major surprises that were either positive or negative. Most hay-related metrics were down in 2020, but not by much, and many of them are simply adding one more dot to a negative trendline that existed before the year began. Corn silage production, on the other hand, continues to expand. Let’s take a dive into the numbers.
December hay stocks
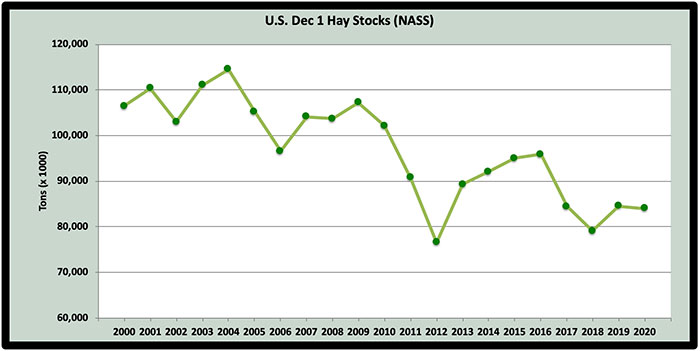
The USDA makes its assessment of dry hay stocks in May and December of each year. Last May, spring hay stocks improved by about 5.5 million tons over the previous year, following three years of decline.
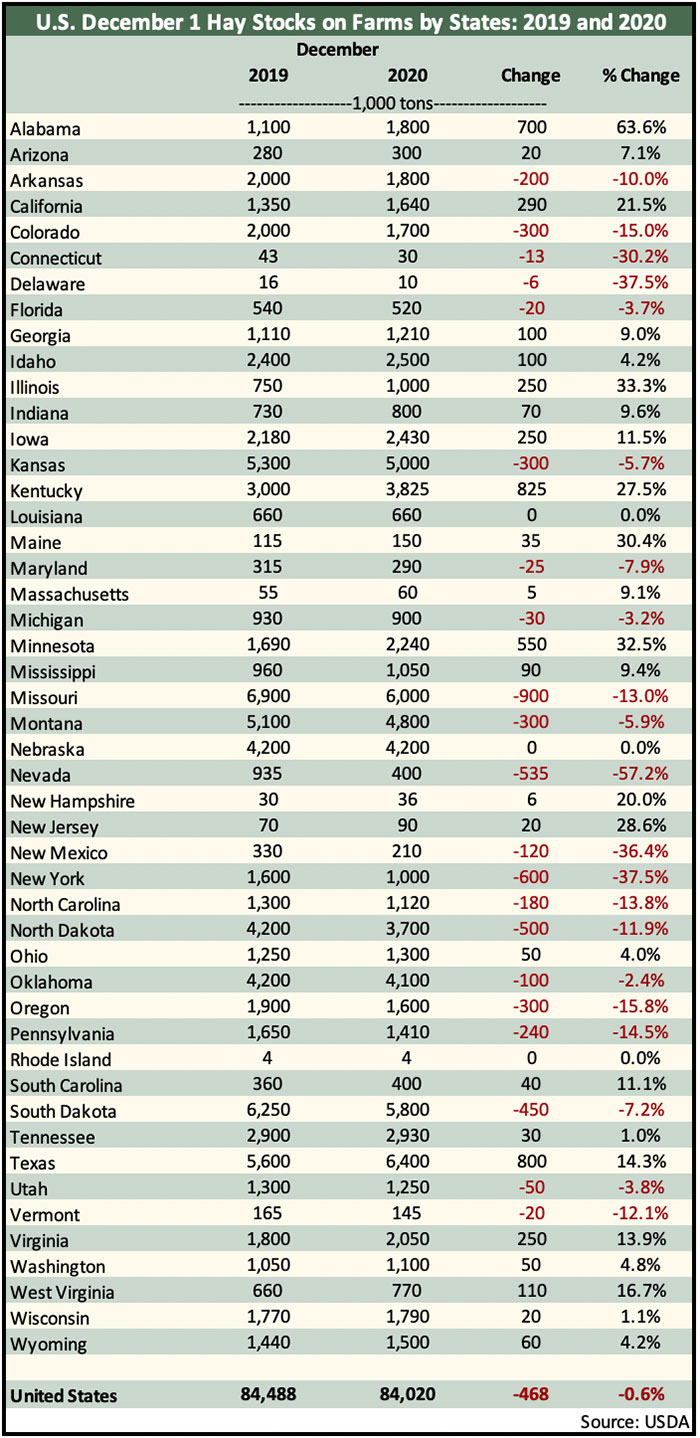
USDA pegged December 1, 2020, hay stocks at about 84 million tons, down 468,000 tons (0.6%) from a year ago. This puts stocks at essentially the same place they were heading into 2018 and 2020. Of course, they are far below the levels seen during the first 10 years of the decade.
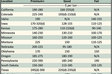
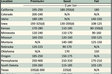
As might be expected, individual states varied in the total amount and direction of hay inventory change (see table below). Of the major hay-producing states, the largest inventory reductions occurred in:
Nevada – down 57.2%
New York – down 37.5%
New Mexico – down 36.4%
Oregon – down 15.8%
Colorado – down 15%
Pennsylvania – down 14.5%
Many states had significant inventory gains. These included:
Alabama – up 63.6%
Illinois – up 33.3%
Minnesota – up 32.5%
Kentucky – up 27.5%
California – up 21.5%
West Virginia – up 16.7%
Bottom line: If hay prices move significantly in 2021, it will likely be the result of some factor other than current hay inventory. Overall, the level of U.S. December 1 hay stocks has dropped about 10 million tons since 2016. At the same time, the U.S. has also experienced a significant decline in the amount of dry hay disappearance between December and the following May. Currently, dairy cow numbers are the rise while beef cows are going in the opposite direction.
Regional differences in hay supplies almost always exist, and high-quality hay is generally in the shortest supply even when overall inventories appear adequate. Also, these inventory numbers do not account for hay stored as high-moisture haylage.
Harvested hay acres
USDA’s Crop Production Annual Summary set the final 2020 harvested hay acreage at 52.3 million, which was just 0.4% fewer acres than last year. The estimates only include acres that had at least one cutting harvested as dry hay.
Once again, Texas led the nation in 2020 with a little over 5 million hay acres and was followed by Missouri (3.07 million acres) and South Dakota (3.05 million acres).
Harvested acres of alfalfa and alfalfa-grass dry hay mixtures declined by about a half million acres (3%).
The top three states for alfalfa dry hay acres harvested in 2020 were Montana (1.9 million), South Dakota (1.8 million), and North Dakota (1.2 million).
Montana had the largest reduction of harvested alfalfa acres in 2020 at 200,000. California continued its downward spiral of alfalfa acres and harvested 105,000 fewer acres than in 2019. The Golden State is now below a half million acres of alfalfa. South Dakota lost 100,000 alfalfa acres in 2020 after several years of significant gains.
Top acreage gainers in 2020 included Iowa (up 130,000), South Dakota (up 105,000), and Washington (up 80,000).
Seventeen states report forage production data with all harvest methods included (hay, haylage, and greenchop). When considering alfalfa acres harvested for all purposes, South Dakota held the top position with 1.85 million acres. Wisconsin followed with 1.66 million acres while Idaho had the third largest acreage at 1.06 million.
New alfalfa seedings
New seedings of alfalfa and alfalfa-grass mixtures in the U.S. during 2020 totaled 2.18 million acres. This was 285,000 fewer acres than 2019. Wisconsin easily had the most new seeding acres at 400,000, which was 80,000 fewer than 2019 but 90,000 more than 2018.
Hay yield
The average U.S. dry hay yield (all types) declined slightly from 2.46 tons per acre in 2019 to 2.43 tons per acre in 2020. For alfalfa and alfalfa-grass mixtures, the year-to-year average yield dropped marginally from 3.28 tons per acre to 3.27 tons per acre.
Arizona and California continued to dominate the average alfalfa yield category in 2020, notching 8.5 and 7.2 tons per acre, respectively.
Looking at the 17 states that report all harvest methods, alfalfa yields on a dry equivalent basis were 3.62 tons per acre, up slightly from 2019. Among these states, only South Dakota at 1.83 tons per acre has a yield of under 3 tons of dry equivalent forage.
Hay production
The 2020 production of all dry hay types in the U.S. totaled 126.8 million tons, down 1.6% from 2019. Total alfalfa dry hay production was pegged at 53.1 million tons, 3.3% below the previous year.
In some states, alfalfa hay production was cut significantly in 2020 compared to 2019. Included in this group are:
South Dakota – down 1,225,000 tons
California – down 698,000 tons
Kansas – down 522,000 tons
Nebraska – down 342,000 tons
Montana – down 345,000 tons
Nevada – down 333,000 tons
Colorado – down 321,000 tons
In some cases, the lower production was caused simply by acreage reductions while other states had a combination of both lower acreage and yield relative to 2019.
Significant dry alfalfa hay production gainers in 2020 were led by:
Wisconsin – up 576,000 tons
Iowa – up 525,000 tons
Minnesota – up 401,000 tons
Pennsylvania – up 315,000 tons
Corn silage
Unlike hay, U.S. corn silage production in 2020 was up 3.1% from the previous year, totaling 1.38 million tons (wet). Corn silage acres increased from 6.6 to 6.7 million acres while the year-over-year yield jumped from 20.2 to 20.5 tons per acre.
Wisconsin easily led the nation in 2020 corn silage production with 20.37 million tons produced and 6.72 million acres. Arizona topped the yield chart with an average mark of 29 tons per acre. California was next in line at 27 tons per acre.
In summary . . .
In 2020, nearly all U.S. hay acreage, yield, and production metrics were marginally lower when compared to the previous year. Taken as a whole, there is nothing here to suggest hay prices will take a deep dive in 2021 because of bulging inventories.
U.S. dry hay production hit its peak in 1999 when 159.6 million tons were produced. Since that time, a slow but steady production decline has taken place, despite higher yields. In addition to producing less dry hay, we are also utilizing smaller amounts through the winter months. The growing popularity of higher moisture hay packages such as baleage might play a factor as well.
Hay markets are generally regional in scope. From these USDA reports, it is easy to see that there were wide state-level range of production gains and declines compared to the previous year. Extreme weather events are becoming more common, and virtually all of these are localized.
In addition to regional weather extremes, there are also localized market factors. For example, in the West, hay exports often help to dictate market prices. In other areas, strong equine markets do the same.
If you’d like to look deeper into the numbers for your specific state, access USDA’s Crop Production Annual Summary.