The annual release of hay and forage data by USDA that defines the previous year’s hay production and year-ending inventories arrived in email inboxes last Thursday. The Crop Production and Crop Production Annual Summary reports offer a glimpse of the current state of the forage industry and provide a gauge to measure hay market sensitivity to various production pressures in 2023.
As in 2021, virtually all forage production metrics were down in 2022 compared to the previous year with only a few exceptions. As expected, drought in the Southern Great Plains took a significant toll in states such as Oklahoma and Texas. Overall, December 1 dry hay stocks hit their lowest point since 1954. Here’s a deep dive into the numbers.
December hay stocks dive
The USDA makes its assessment of dry hay stocks in May and December of each year. Last May, spring hay stocks declined 18%, or about 3.7 million tons compared to the previous year.
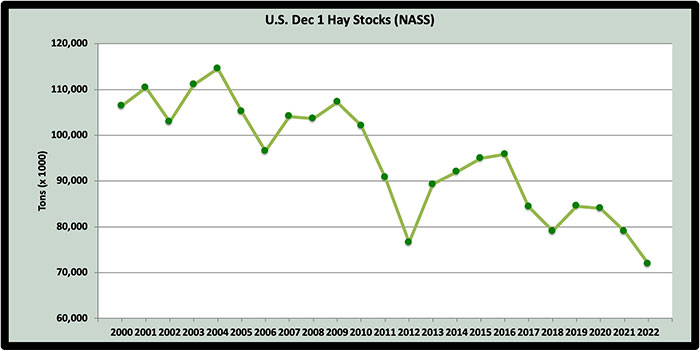
USDA pegged December 1, 2022, hay stocks at about 71.9 million tons, down over 7 million tons (9%) from a year ago. This puts stocks at a level not seen in the era of modern hay production and far below the levels seen during the first 10 years of this century.
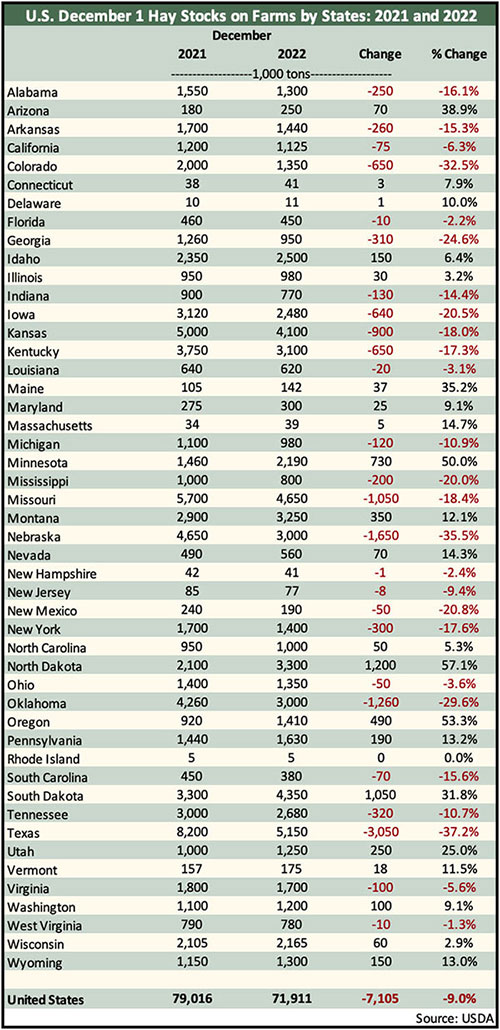
As might be expected, individual states varied in the total amount and direction of year-over-year hay inventory change (see table below). Of the major hay-producing states, the largest inventory reductions occurred in those that were hit hard by drought in 2022:
Texas – down 37.2%
Nebraska – down 35.5%
Colorado – down 32.5%
Oklahoma – down 29.6%
Georgia – down 24.6%
Some states had significant inventory gains. These included several states that experienced serious drought in 2021 but had improved conditions in 2022:
North Dakota – up 57.1%
Oregon – up 53.3%
Minnesota – up 50%
Arizona – up 38.9%
South Dakota – up 31.8%
Bottom line: The lower December hay stocks came as no surprise; it was just a matter of to what degree. Overall, the level of U.S. December 1 hay stocks has dropped nearly 24 million tons since 2016. At the same time, the U.S. has also experienced a significant decline in the amount of dry hay disappearance between December and the following May. It’s probably fair to assume that the reduced stocks were driven more by the decline in grass hay inventories than that of alfalfa.
Regional differences in hay supplies almost always exist, and high-quality hay is generally in the shortest supply even when overall inventories appear adequate. Current inventories will continue to support historically high hay prices. Even so, keep in mind that these inventory numbers do not account for hay stored as higher moisture chopped haylage and baleage.
Harvested hay acres
The USDA’s Crop Production Annual Summary set the final 2022 harvested hay acreage (all types) at 49.5 million, which was 2.3% fewer acres than the previous year. The estimate only includes acres that had at least one cutting harvested as dry hay.
Once again, Texas led the nation with nearly 4.2 million dry hay acres in 2022, but this acreage was down over 25% from 2021. Missouri (3.18 million acres) had the second most hay acres harvested and was followed by Oklahoma (3 million acres). South Dakota rebounded after a tough 2021 and harvested 2.95 million acres to finish in the fourth position.
Harvested acres of alfalfa and alfalfa-grass dry hay mixtures in the U.S. declined by 2.2% to 14.9 million, which was a loss of 333,000 acres.
The top three states for alfalfa dry hay acres harvested in 2022 were South Dakota (1.65 million), Montana (1.4 million), and North Dakota (1.1 million).
Overall, the reduction in alfalfa acres wasn’t nearly as severe as it was the previous year. This is likely because the drought in 2021 impacted more large alfalfa-producing states compared to 2022. Iowa had the largest reduction of harvested alfalfa acres in 2022 at 180,000. Colorado followed with a loss of 170,000 alfalfa acres while Montana dropped by 150,000 acres. On a percentage basis, Missouri was notable with nearly 46% fewer alfalfa acres harvested in 2022 compared to 2021.
Top alfalfa acreage gainers in 2022 included South Dakota (up 350,000), North Dakota (up 180,000), and Idaho (up 100,000).
Seventeen states report forage production data with all harvest methods included (hay, haylage, and greenchop). When considering alfalfa acres harvested for all purposes, South Dakota regained the top position from Wisconsin in 2022 with 1.68 million acres of alfalfa harvested. Wisconsin checked in with 1.63 million acres while Idaho maintained its third-place position with 1.1 million acres.
New alfalfa seedings
New seedings of alfalfa and alfalfa-grass mixtures in the U.S. during 2022 totaled 1.67 million acres, which was 29,000 acres more than 2021. Wisconsin easily had the highest number of new-seeding acres at 260,000 but was still down 40,000 acres from the previous year and 140,000 acres from 2020. Three other states had new seeding alfalfa acres totaling 100,000 or more in 2022: Idaho, Minnesota, and Nebraska.
Hay yield
The average U.S. dry hay yield (all types) declined from 2.37 tons per acre in 2021 to 2.28 tons per acre in 2022. For alfalfa and alfalfa-grass mixtures, the year-to-year average yield dropped minimally from 3.23 to 3.22 tons per acre.
Arizona and California continued to dominate the average alfalfa yield category in 2022, harvesting 8.2 and 7.2 tons per acre, respectively.
Looking at the 17 states that report all harvest methods, alfalfa yields on a dry equivalent basis were 3.58 tons per acre, down 0.1 tons from 2021. Among these 17 states, only South Dakota (1.74 tons per acre) and Missouri (2.72 tons per acre) had an average yield under 3 tons of dry-equivalent forage.
Hay production
The 2022 production of all dry hay types in the U.S. totaled 112.8 million tons, down 6.2% from 2021 and 11% from 2020. Texas, Colorado, and Nebraska all had year-over-year total hay production reductions of over 30%. Conversely, North Dakota boosted their hay production by over 80% from 2021 to 2022. Both South Dakota (up 46.9%) and Minnesota (up 37.4%) harvested significantly more dry hay as well.
Total alfalfa dry hay production was pegged at nearly 48 million tons, 2.6% below the previous year and slightly below USDA’s October estimate.
In some states, alfalfa hay production was cut significantly in 2022 compared to 2021. Leading this group were:
Colorado – down 1,351,000 tons
Nebraska – down 1,282,000 tons
In both cases, the lower production was caused by reductions in both acres and yield relative to 2021. No other states have production declines of more than 500,000 tons.
Significant dry alfalfa hay production gainers in 2022 were led by:
North Dakota – up 1,317,000 tons
South Dakota – up 855,000 tons
Idaho – up 622,000 tons
When all harvest methods are considered (dry hay, haylage, and greenchop), Wisconsin led all states in alfalfa production with 6.3 million tons produced in 2022. Idaho followed with 5.1 million tons while California posted a final production total of 3.4 million tons.
Corn silage
Corn silage production in the U.S. declined for the second consecutive year due to a drop in average yield from 20.1 to 18.7 tons per acre. Acreage of corn silage continued its ascent, increasing from 6.45 to 6.86 million acres. Combined, these factors resulted in a final 2022 corn silage production total of 128.6 million tons, down 862,000 tons, or less than 1% from the previous year.
As it always does, Wisconsin easily led the nation in corn silage production in 2022 with 19.8 million tons produced from 880,000 acres. Idaho topped the yield chart in 2022 with an average mark of 29 tons per acre. Arizona and Oregon followed closely behind at 28 tons per acre.
In summary . . .
As was the case in 2021, most 2022 U.S. hay acreage, yield, and production metrics were marginally or significantly lower when compared to the previous year. With hay stocks as low as they’ve been in 70 years, historically high hay prices will likely remain until hay barns can again be replenished.
Grass hay production in the Southern Plains was especially impacted in 2022, resulting from extreme drought. This entailed some large hay-producing states. For example, grass hay production in Texas was down about 4 million tons from 2021. That production loss alone accounted for two-thirds of the nation’s reduction in grass hay produced in 2022.
U.S. dry hay production hit its peak in 1999 when 159.6 million tons were produced. Since that time, a slow but steady production decline has taken place, despite higher yields. In addition to producing less dry hay, we are also utilizing smaller amounts through the winter months even though beef and dairy cattle numbers have remained relatively stable. The growing popularity of higher moisture hay harvest methods such as baleage might play a factor as well.
Hay markets are generally regional in scope. From these USDA reports, it’s easy to see that there was a wide state-level range of production gains and declines compared to the previous year. Extreme weather events are becoming more common, and virtually all of these are localized. There’s a reason why farmers talk a lot about the weather; it’s the tail that wags the hay-producing dog.
In addition to regional weather extremes, there are also localized market factors. For example, in the West, hay exports often help to dictate market prices. In other areas, strong equine markets do the same. Most states in the Midwest appear to have adequate supplies of forage this winter. This is also the region where hay prices have somewhat moderated.
If you’d like to look deeper into the numbers for your specific state, access USDA’s Crop Production Annual Summary.