The author is the director of nutrition research and innovation with Rock River Lab Inc., and adjunct assistant professor, University of Wisconsin-Madison’s Dairy Science Department.
Environmental conditions prior to and during the growing season impact the resulting crop yield and quality. Over the past 10 years, the growing season has contributed sizable variance to forage quality, as defined by nutrient content and nutrient digestibility.
Each year, we review crop quality by evaluating bell curves and population statistics for alfalfa hay or haylage and corn silage. We define the year-over-year populations as April to April for hay and haylage and September to September for corn silage. Then we compare the means and distribution for insights. As we turn the page to 2024, let’s look back at 2023 but through the lens of a feed analysis report. We can reverse engineer a nutrition report to gain insights into the growing season’s impact on your farm and its crops’ morphology.
Relate to plant morphology
Morphology is a big word, meaning relating to the plant’s physical structure or form. With this understanding, we start with connecting your feed analysis to crop morphology. On the feed analysis, forage quality is defined by nutrient measures and nutrient digestibility. Fiber is a key nutrient within corn, grass, and alfalfa that is inversely related to other nutrients. With corn, fiber is inversely related to starch, whereas with alfalfa or grass, the inverse relationship is with protein and sugar. I make this point because the plant’s physical form at harvest is directly proportional to the fiber content.
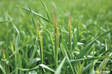
Flipping this relationship around, the first step to reverse engineering your feed analysis report begins with fiber. As discussed in the last issue’s “Feed Analysis” column, hay or haylage fiber and protein measures are related to leaf-to-stem ratio. More fiber equates to more stem and less leaves. We also know that leaf percentage is influenced by agronomic practices, soil fertility, harvest timing, and growing conditions, so here’s our connection from the analysis to the cropping year conditions.
For 2023, relative to the prior few years, the West was up in fiber, the Midwest was down, and the Eastern region was similar year over year. The Western hay is up in fiber and down in protein following adequate snowpack and rainfall. Sufficient water likely stretched out plants with more stem and less leaves. If your fiber levels are up in hay, consider the impact that irrigation or water had upon the plant’s leaf-to-stem ratio.
The Midwest experienced extensive drought to start the year, which stunted alfalfa and equated to more leaves and diluted out the fiber for many growers. From East to West, evaluate your hay or haylage fiber-to-protein ratios compared to prior years. If your harvest timing was similar but fiber-to-protein levels were up or down, make the connection back to your forage leaf-to-stem ratio and growing conditions or agronomic practices.
Higher yields, less starch
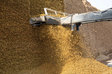
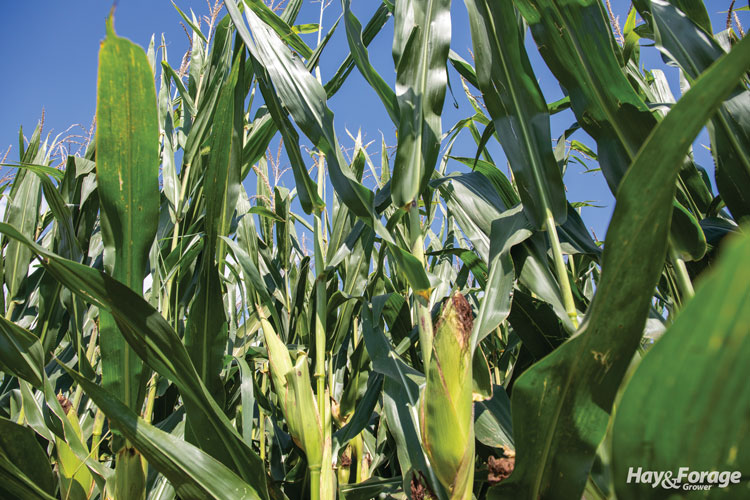
For corn, the plant morphology insights come from also equating it to fiber. The fiber and starch results on your corn silage analysis offers insight into the grain-to-stover ratio. Understanding the grain-to-stover ratio then helps explain how the growing season differentially impacts plant morphology from one year to the next. Case in point, corn silage yields were up this year for many Western growers; however, starch content was similar to 2022 and well below long-term averages.
Historically, more grain equates to higher yields, but that didn’t materialize this year. Based upon nutrition analysis reports for Western growers, the corn in 2022 and 2023 must have had similar grain-to-stover ratios. But for 2023, the plants must have been substantially taller and larger thanks to ample water and cheaper crop inputs. Taller plants and more stover diluted out the grain for many growers and netted a similar fiber-to-starch ratio compared with the 2022 silage analysis and poorer corn. Your forage fiber and starch measures can help add context to the discussion with your agronomist and harvest team.
As noted for haylage, the corn-growing season was quite different in the Midwest and eastern U.S. regions. Drought appeared to hamper corn plant height for many. Yet the 2023 silage starch content was average to higher, meaning that short-statured plants still managed to grow reasonable ears thanks to timely rains during pollination and ear fill. Take your silage analysis reports back to your agronomist and also discuss the plant stature and grain-to-stover outcomes for your farm.
Fiber, starch, and protein aren’t the only laboratory measures that provide insight into the growing season. Fiber digestibility also helps explain the growing season’s impact on the plant but on a cellular level. For corn silage, drought around the V5 to V7 developmental stages tends to improve fiber digestibility (NDFD) and adequate or excessive rainfall or water tends to reduce NDFD. If your silage fiber digestibility is substantially up or down relative to last year, look back to the rainfall early in the growing season. Share your feed analyses with your agronomist and reflect on your 2023 crop by reverse engineering the reports as we’ve discussed here.
This article appeared in the January 2024 issue of Hay & Forage Grower on page 24.
Not a subscriber? Click to get the print magazine.