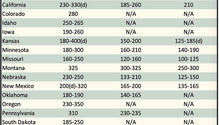
Below are examples of alfalfa and grass prices being paid FOB barn/stack (except for those noted as delivered, which are indicated by a "d" in the table below) for selecte
Below are examples of alfalfa and grass prices being paid FOB barn/stack (except for those noted as delivered, which are indicated by a "d" in the table below) for selected
Below are examples of alfalfa and grass prices being paid FOB barn/stack (except for those noted as delivered, which are indicated by a "d" in the table below) for selected st
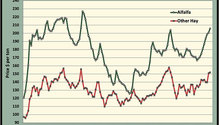
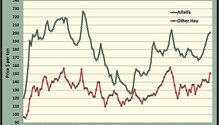
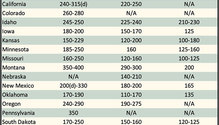
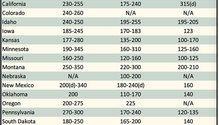
The average alfalfa hay price during August hiked to $206 per ton, which was the highest monthly average since August 2014. Not only was the August price historically high, but it also came during a t
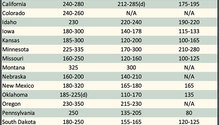
Below are examples of alfalfa and grass prices being paid FOB barn/stack (except for those noted as delivered, which are indicated by a "d" in the table below) for selected stat
Below are examples of alfalfa and grass prices being paid FOB barn/stack (except for those noted as delivered, which are indicated by a "d" in the table below) for selected states
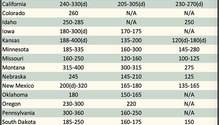
Below are examples of alfalfa and grass prices being paid FOB barn/stack (except for those noted as delivered, which are indicated by a "d" in the table below) for selected states a
Below are examples of alfalfa and grass prices being paid FOB barn/stack (except for those noted as delivered, which are indicated by a "d" in the table below) for selected states at
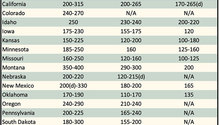
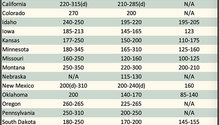
Hay prices typically don’t trend higher in the middle of summer, but that’s exactly what is happening in 2021. The average price of U.S. alfalfa hay in July rose another $2 per ton, according
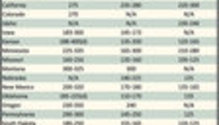
Below are examples of alfalfa and grass prices being paid FOB barn/stack (except for those noted as delivered, which are indicated by a "d" in the table below) for selected states at the
Below are examples of alfalfa and grass prices being paid FOB barn/stack (except for those noted as delivered, which are indicated by a "d" in the table below) for selected states at the e
Below are examples of alfalfa and grass prices being paid FOB barn/stack (except for those noted as delivered, which are indicated by a "d" in the table below) for selected states at the end
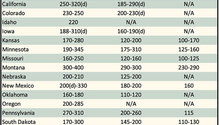
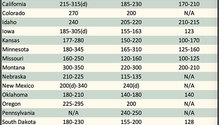
The average price of U.S. alfalfa hay in June jumped another $5 per ton, according to USDA’s Agricultural Prices report. It was the seventh consecutive month that the alfalfa price posted a month-over-month
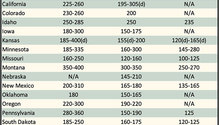
Below are examples of alfalfa and grass prices being paid FOB barn/stack (except for those noted as delivered, which are indicated by a "d" in the table below) for selected states at the end of the
Below are examples of alfalfa and grass prices being paid FOB barn/stack (except for those noted as delivered, which are indicated by a "d" in the table below) for selected states at the end of the
Below are examples of alfalfa and grass prices being paid FOB barn/stack (except for those noted as delivered, which are indicated by a "d" in the table below) for selected states at the end of the day